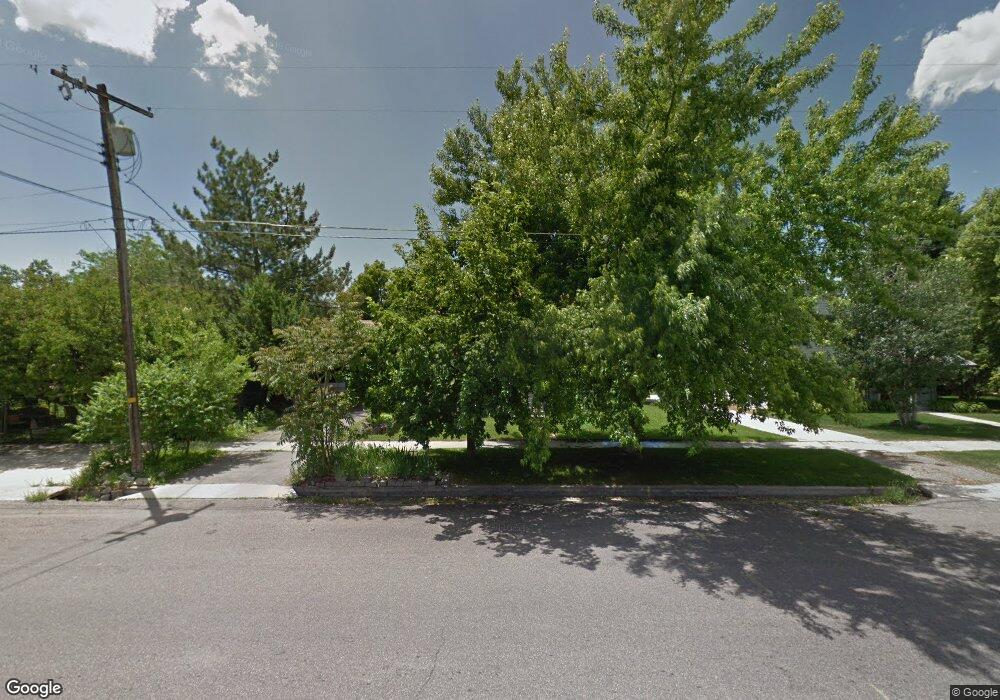
27 N 100 E Smithfield, UT 84335
Estimated Value: $330,000 - $349,000
3
Beds
1
Bath
1,876
Sq Ft
$180/Sq Ft
Est. Value
About This Home
This home is located at 27 N 100 E, Smithfield, UT 84335 and is currently estimated at $336,876, approximately $179 per square foot. 27 N 100 E is a home located in Cache County with nearby schools including Summit School, North Cache Middle School, and White Pine Middle School.
Ownership History
Date
Name
Owned For
Owner Type
Purchase Details
Closed on
Jun 17, 2010
Sold by
Moosman Shannon T
Bought by
Thorpe Timothy Lance and Moosman Shannon T
Current Estimated Value
Home Financials for this Owner
Home Financials are based on the most recent Mortgage that was taken out on this home.
Original Mortgage
$105,164
Outstanding Balance
$71,174
Interest Rate
5.25%
Mortgage Type
FHA
Estimated Equity
$265,702
Purchase Details
Closed on
Aug 17, 2007
Sold by
Perkins Jeremy L and Moosman Shannon T
Bought by
Moosman Shannon T
Purchase Details
Closed on
Aug 13, 2002
Sold by
Sanders Karen M and The Ira Lagrand Moosman Family
Bought by
Perkins Jeremy L and Moosman Shannon T
Home Financials for this Owner
Home Financials are based on the most recent Mortgage that was taken out on this home.
Original Mortgage
$85,260
Interest Rate
6.51%
Mortgage Type
FHA
Create a Home Valuation Report for This Property
The Home Valuation Report is an in-depth analysis detailing your home's value as well as a comparison with similar homes in the area
Home Values in the Area
Average Home Value in this Area
Purchase History
| Date | Buyer | Sale Price | Title Company |
|---|---|---|---|
| Thorpe Timothy Lance | -- | Nations Title Agency Inc | |
| Moosman Shannon T | -- | Northern Title Company | |
| Perkins Jeremy L | -- | American Secure Title |
Source: Public Records
Mortgage History
| Date | Status | Borrower | Loan Amount |
|---|---|---|---|
| Open | Thorpe Timothy Lance | $105,164 | |
| Closed | Perkins Jeremy L | $85,260 |
Source: Public Records
Tax History
| Year | Tax Paid | Tax Assessment Tax Assessment Total Assessment is a certain percentage of the fair market value that is determined by local assessors to be the total taxable value of land and additions on the property. | Land | Improvement |
|---|---|---|---|---|
| 2025 | $1,360 | $182,120 | $0 | $0 |
| 2024 | $1,577 | $198,095 | $0 | $0 |
| 2023 | $1,669 | $198,235 | $0 | $0 |
| 2022 | $1,553 | $181,495 | $0 | $0 |
| 2021 | $1,463 | $261,250 | $64,820 | $196,430 |
| 2020 | $1,297 | $215,920 | $64,820 | $151,100 |
| 2019 | $1,233 | $195,750 | $44,650 | $151,100 |
| 2018 | $1,086 | $166,730 | $44,650 | $122,080 |
| 2017 | $1,008 | $84,510 | $0 | $0 |
| 2016 | $1,025 | $84,510 | $0 | $0 |
| 2015 | $1,030 | $84,510 | $0 | $0 |
| 2014 | $1,009 | $84,505 | $0 | $0 |
| 2013 | -- | $83,830 | $0 | $0 |
Source: Public Records
Map
Nearby Homes
Your Personal Tour Guide
Ask me questions while you tour the home.