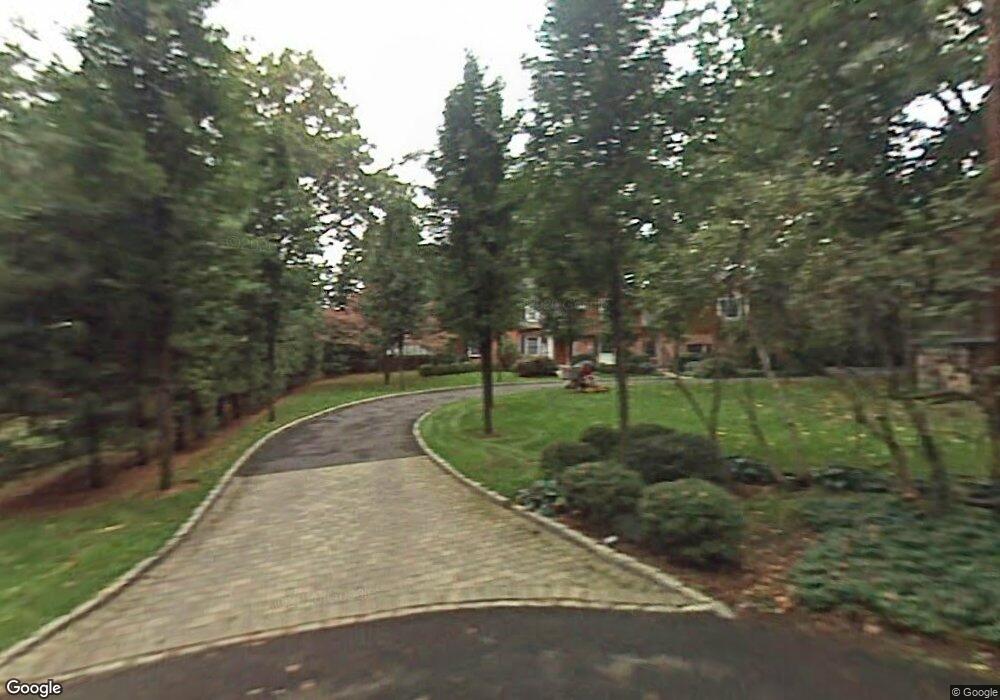
27 N Brae Ct Tenafly, NJ 07670
Estimated Value: $2,556,000 - $2,932,000
--
Bed
--
Bath
4,487
Sq Ft
$617/Sq Ft
Est. Value
About This Home
This home is located at 27 N Brae Ct, Tenafly, NJ 07670 and is currently estimated at $2,768,044, approximately $616 per square foot. 27 N Brae Ct is a home located in Bergen County with nearby schools including Tenafly Middle School, Tenafly High School, and Spring School.
Ownership History
Date
Name
Owned For
Owner Type
Purchase Details
Closed on
Jun 5, 2023
Sold by
Shohet Michael and Shohet Raina
Bought by
Raina Wallens Family Trust and Michael Shohet Family Trust
Current Estimated Value
Purchase Details
Closed on
Mar 19, 2013
Sold by
Norton Karen I and Sobel Louis I
Bought by
Wallens Raina and Shohet Michael
Home Financials for this Owner
Home Financials are based on the most recent Mortgage that was taken out on this home.
Original Mortgage
$1,100,000
Interest Rate
2.55%
Mortgage Type
Stand Alone Refi Refinance Of Original Loan
Create a Home Valuation Report for This Property
The Home Valuation Report is an in-depth analysis detailing your home's value as well as a comparison with similar homes in the area
Home Values in the Area
Average Home Value in this Area
Purchase History
| Date | Buyer | Sale Price | Title Company |
|---|---|---|---|
| Raina Wallens Family Trust | -- | None Listed On Document | |
| Wallens Raina | $1,400,000 | -- |
Source: Public Records
Mortgage History
| Date | Status | Borrower | Loan Amount |
|---|---|---|---|
| Previous Owner | Wallens Raina | $1,100,000 |
Source: Public Records
Tax History Compared to Growth
Tax History
| Year | Tax Paid | Tax Assessment Tax Assessment Total Assessment is a certain percentage of the fair market value that is determined by local assessors to be the total taxable value of land and additions on the property. | Land | Improvement |
|---|---|---|---|---|
| 2025 | $51,189 | $1,801,800 | $808,900 | $992,900 |
| 2024 | $49,946 | $1,801,800 | $808,900 | $992,900 |
| 2023 | $48,739 | $1,801,800 | $808,900 | $992,900 |
| 2022 | $48,739 | $1,801,800 | $808,900 | $992,900 |
| 2021 | $47,874 | $1,801,800 | $808,900 | $992,900 |
| 2020 | $47,171 | $1,801,800 | $808,900 | $992,900 |
| 2019 | $46,342 | $1,801,800 | $808,900 | $992,900 |
| 2018 | $45,622 | $1,801,800 | $808,900 | $992,900 |
| 2017 | $45,459 | $1,801,800 | $808,900 | $992,900 |
| 2016 | $44,559 | $1,801,800 | $808,900 | $992,900 |
| 2015 | $43,568 | $1,801,800 | $808,900 | $992,900 |
| 2014 | $42,757 | $1,766,200 | $808,900 | $957,300 |
Source: Public Records
Map
Nearby Homes