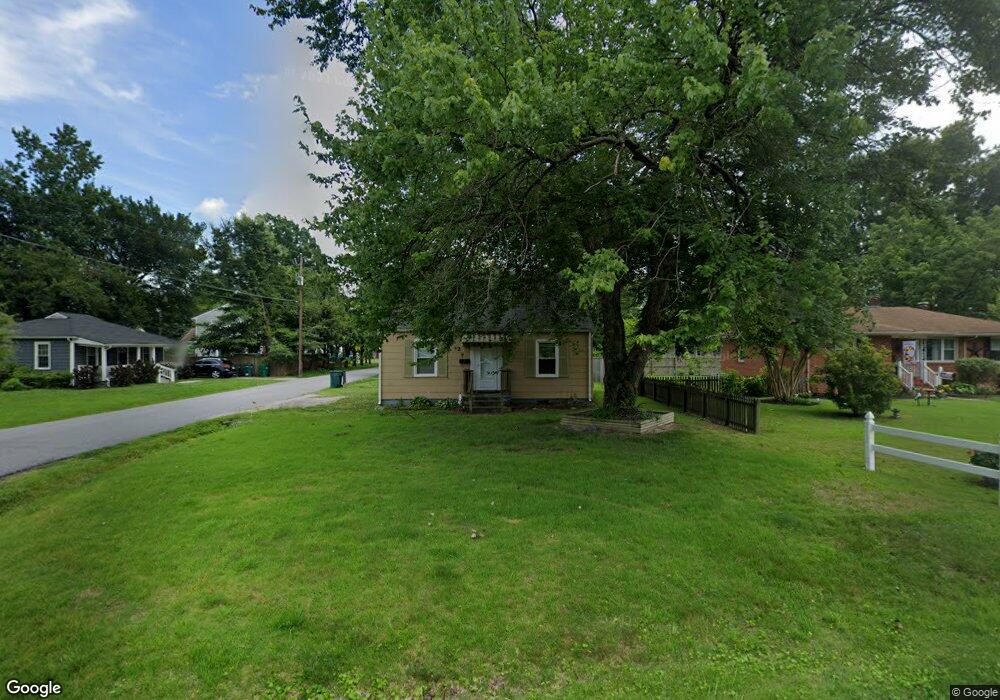
27 N Bridge St Highland Springs, VA 23075
Estimated Value: $177,000 - $226,000
3
Beds
1
Bath
910
Sq Ft
$229/Sq Ft
Est. Value
About This Home
This home is located at 27 N Bridge St, Highland Springs, VA 23075 and is currently estimated at $208,028, approximately $228 per square foot. 27 N Bridge St is a home located in Henrico County with nearby schools including Fair Oaks Elementary School, Elko Middle School, and Highland Springs High School.
Ownership History
Date
Name
Owned For
Owner Type
Purchase Details
Closed on
Dec 22, 2021
Sold by
Haley Florence H
Bought by
Etheridge Jonathan L
Current Estimated Value
Home Financials for this Owner
Home Financials are based on the most recent Mortgage that was taken out on this home.
Original Mortgage
$128,250
Outstanding Balance
$117,956
Interest Rate
3.11%
Mortgage Type
New Conventional
Estimated Equity
$90,072
Purchase Details
Closed on
Mar 23, 2012
Sold by
Stuller Brandi A
Bought by
Haley Florence H
Home Financials for this Owner
Home Financials are based on the most recent Mortgage that was taken out on this home.
Original Mortgage
$58,381
Interest Rate
4.4%
Mortgage Type
FHA
Purchase Details
Closed on
Apr 20, 2001
Sold by
Richardson John H
Bought by
Trievel Kevin J and Stuller Brandi A
Home Financials for this Owner
Home Financials are based on the most recent Mortgage that was taken out on this home.
Original Mortgage
$55,134
Interest Rate
6.9%
Mortgage Type
FHA
Create a Home Valuation Report for This Property
The Home Valuation Report is an in-depth analysis detailing your home's value as well as a comparison with similar homes in the area
Home Values in the Area
Average Home Value in this Area
Purchase History
| Date | Buyer | Sale Price | Title Company |
|---|---|---|---|
| Etheridge Jonathan L | $135,000 | Bon Air/Long & Foster Title | |
| Haley Florence H | $59,000 | -- | |
| Trievel Kevin J | $56,000 | -- |
Source: Public Records
Mortgage History
| Date | Status | Borrower | Loan Amount |
|---|---|---|---|
| Open | Etheridge Jonathan L | $128,250 | |
| Previous Owner | Haley Florence H | $58,381 | |
| Previous Owner | Trievel Kevin J | $55,134 |
Source: Public Records
Tax History Compared to Growth
Tax History
| Year | Tax Paid | Tax Assessment Tax Assessment Total Assessment is a certain percentage of the fair market value that is determined by local assessors to be the total taxable value of land and additions on the property. | Land | Improvement |
|---|---|---|---|---|
| 2025 | $1,488 | $158,200 | $32,500 | $125,700 |
| 2024 | $1,488 | $144,100 | $28,500 | $115,600 |
| 2023 | $1,239 | $144,100 | $28,500 | $115,600 |
| 2022 | $908 | $110,700 | $28,500 | $82,200 |
| 2021 | $862 | $87,600 | $20,500 | $67,100 |
| 2020 | $771 | $87,600 | $20,500 | $67,100 |
| 2019 | $707 | $80,300 | $18,000 | $62,300 |
| 2018 | $670 | $76,100 | $18,000 | $58,100 |
| 2017 | $610 | $69,300 | $18,000 | $51,300 |
| 2016 | $568 | $64,500 | $18,000 | $46,500 |
| 2015 | $605 | $64,300 | $22,000 | $42,300 |
| 2014 | $605 | $68,700 | $22,000 | $46,700 |
Source: Public Records
Map
Nearby Homes
- 104 N Beech Ave
- 15 N Battery St
- 16 N Elm Ave
- 4 N Elm Ave
- 120 N Grove Ave
- 202 N Grove Ave
- 505 Wales Dr
- 14 Beauregard Ave
- 11, 13, 17 N Holly Ave
- 500 N Daisy Ave
- 111 S Grove Ave
- 00 N Lake Ave
- 304 Colonel Dr
- 238 N Kalmia Ave
- 402 N Ivy Ave
- 111 N Mapleleaf Ave
- 227 N Linden Ave
- 9 Forest Ave
- 4 W Jerald St
- 233 N Mapleleaf Ave