Estimated Value: $4,118,000 - $4,747,000
4
Beds
6
Baths
6,299
Sq Ft
$708/Sq Ft
Est. Value
About This Home
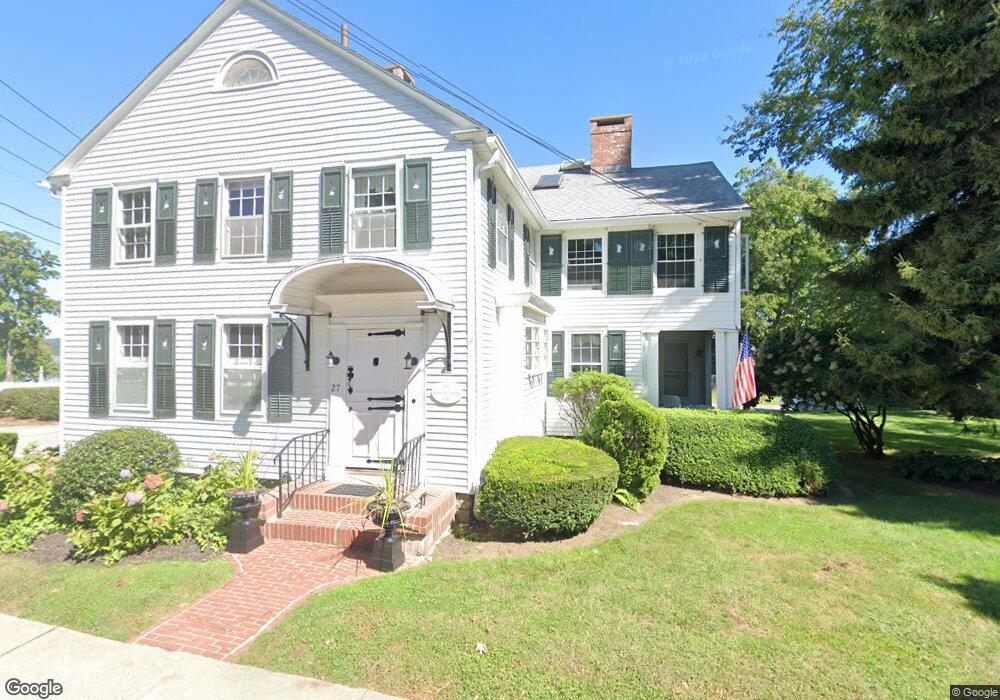
This home is located at 27 N Main St, Essex, CT 06426 and is currently estimated at $4,458,127, approximately $707 per square foot. 27 N Main St is a home located in Middlesex County with nearby schools including Valley Regional High School and The Children's Tree Montessori.
Ownership History
Date
Name
Owned For
Owner Type
Purchase Details
Closed on
Dec 15, 2020
Sold by
Hill Charles H and Hill Catherine A
Bought by
Kay T Hood Ret
Current Estimated Value
Purchase Details
Closed on
Dec 16, 2016
Sold by
Johnson Ned B and Johnson Helene M
Bought by
Hill Charles H and Hill Catherine A
Purchase Details
Closed on
Apr 29, 1996
Sold by
Holland Donald M
Bought by
Johnson Ned B and Johnson Helene M
Create a Home Valuation Report for This Property
The Home Valuation Report is an in-depth analysis detailing your home's value as well as a comparison with similar homes in the area
Home Values in the Area
Average Home Value in this Area
Purchase History
| Date | Buyer | Sale Price | Title Company |
|---|---|---|---|
| Kay T Hood Ret | -- | None Available | |
| Kay T Hood Ret | -- | None Available | |
| Hill Charles H | $1,980,650 | -- | |
| Hill 3Rd Charles H | $1,980,650 | -- | |
| Johnson Ned B | $473,500 | -- | |
| Johnson Ned B | $473,500 | -- |
Source: Public Records
Mortgage History
| Date | Status | Borrower | Loan Amount |
|---|---|---|---|
| Previous Owner | Johnson Ned B | $950,000 | |
| Previous Owner | Johnson Ned B | $800,000 |
Source: Public Records
Tax History Compared to Growth
Tax History
| Year | Tax Paid | Tax Assessment Tax Assessment Total Assessment is a certain percentage of the fair market value that is determined by local assessors to be the total taxable value of land and additions on the property. | Land | Improvement |
|---|---|---|---|---|
| 2025 | $43,708 | $2,346,120 | $557,700 | $1,788,420 |
| 2024 | $45,528 | $2,522,300 | $557,700 | $1,964,600 |
| 2023 | $24,738 | $1,095,100 | $548,300 | $546,800 |
| 2022 | $24,804 | $1,095,100 | $548,300 | $546,800 |
| 2021 | $24,563 | $1,095,100 | $548,300 | $546,800 |
| 2020 | $23,884 | $1,095,100 | $548,300 | $546,800 |
| 2019 | $22,254 | $1,027,900 | $548,300 | $479,600 |
| 2018 | $18,516 | $847,400 | $506,200 | $341,200 |
| 2017 | $18,609 | $847,400 | $506,200 | $341,200 |
| 2016 | $17,937 | $831,200 | $506,200 | $325,000 |
| 2015 | $17,522 | $831,200 | $506,200 | $325,000 |
| 2014 | $17,447 | $831,200 | $506,200 | $325,000 |
Source: Public Records
Map
Nearby Homes
- 27 N Main St
- 27 N Main St Unit 4
- 27 N Main St Unit 2
- 27 N Main St Unit 6
- 27 N Main St Unit 1
- 27 N Main St Unit 8
- 27 N Main St Unit 5
- 27 N Main St Unit 7
- 27 N Main St Unit 3
- 21 N Main St
- 19 N Main St
- 26 N Main St
- 6 Little Point St
- 8 Dickinson Ln
- 17 N Main St
- 22 N Main St
- 22 N Main St
- 4 Prospect St
- 10 Little Point St
- 2 Prospect St