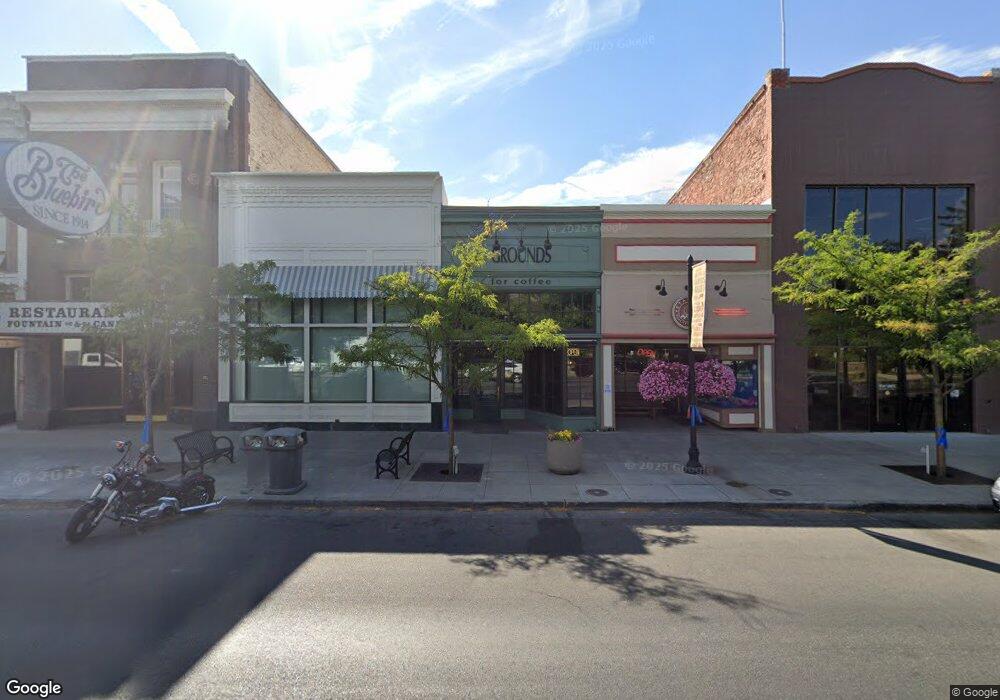
27 N Main St Logan, UT 84321
Ellis NeighborhoodEstimated Value: $491,000 - $634,862
--
Bed
--
Bath
4,718
Sq Ft
$119/Sq Ft
Est. Value
About This Home
This home is located at 27 N Main St, Logan, UT 84321 and is currently estimated at $562,931, approximately $119 per square foot. 27 N Main St is a home located in Cache County with nearby schools including Ellis School, Mount Logan Middle School, and Logan High School.
Ownership History
Date
Name
Owned For
Owner Type
Purchase Details
Closed on
Jun 28, 2022
Sold by
Monkebean Main Llc
Bought by
Corbran Kenneth J
Current Estimated Value
Purchase Details
Closed on
Jan 15, 2021
Sold by
Monkeybean Enterprises Llc
Bought by
Monkebean Main Llc and Corbran
Purchase Details
Closed on
Jun 25, 2019
Sold by
Fallin T Wade and Fallin Kelley
Bought by
Monkeybean Enterprises Llc
Purchase Details
Closed on
Jul 14, 2010
Sold by
Chandler Hill Investment Llc
Bought by
Fallin T Wade and Fallin Kelley
Purchase Details
Closed on
Aug 6, 2007
Sold by
Needham S Eugene and Needham Julie C
Bought by
Chandler Hill Investment Llc
Home Financials for this Owner
Home Financials are based on the most recent Mortgage that was taken out on this home.
Original Mortgage
$181,717
Interest Rate
6.65%
Mortgage Type
Commercial
Purchase Details
Closed on
Nov 30, 2004
Sold by
Needham S Eugene and Needham Julie C
Bought by
Needham S Eugene and Needham Julie C
Create a Home Valuation Report for This Property
The Home Valuation Report is an in-depth analysis detailing your home's value as well as a comparison with similar homes in the area
Home Values in the Area
Average Home Value in this Area
Purchase History
| Date | Buyer | Sale Price | Title Company |
|---|---|---|---|
| Corbran Kenneth J | -- | Farr Cragun & Berube Pc | |
| Monkebean Main Llc | -- | None Available | |
| Monkebean Main Llc | -- | None Listed On Document | |
| Monkeybean Enterprises Llc | -- | Inwest Title Svcs Inc Logan | |
| Fallin T Wade | -- | Cache Title Company | |
| Chandler Hill Investment Llc | -- | Cache Title Company | |
| Needham S Eugene | -- | Cache Title Company | |
| Needham S Eugene | -- | None Available |
Source: Public Records
Mortgage History
| Date | Status | Borrower | Loan Amount |
|---|---|---|---|
| Previous Owner | Chandler Hill Investment Llc | $181,717 |
Source: Public Records
Tax History Compared to Growth
Tax History
| Year | Tax Paid | Tax Assessment Tax Assessment Total Assessment is a certain percentage of the fair market value that is determined by local assessors to be the total taxable value of land and additions on the property. | Land | Improvement |
|---|---|---|---|---|
| 2025 | $4,541 | $587,262 | $114,109 | $473,153 |
| 2024 | $4,732 | $592,717 | $103,735 | $488,982 |
| 2023 | $3,292 | $393,110 | $98,795 | $294,315 |
| 2022 | $348 | $388,405 | $94,090 | $294,315 |
| 2021 | $3,786 | $358,708 | $78,408 | $280,300 |
| 2020 | $4,207 | $358,708 | $78,408 | $280,300 |
| 2019 | $3,830 | $312,408 | $78,408 | $234,000 |
| 2018 | $4,194 | $312,408 | $78,408 | $234,000 |
| 2017 | $4,363 | $312,410 | $0 | $0 |
| 2016 | $4,524 | $309,805 | $0 | $0 |
| 2015 | $4,455 | $307,295 | $0 | $0 |
| 2014 | $4,027 | $307,295 | $0 | $0 |
| 2013 | -- | $307,295 | $0 | $0 |
Source: Public Records
Map
Nearby Homes
- 31 N Main St
- 31 N Main St Unit 2ND FL
- 33 N Main St Unit 211
- 47 N Main St
- 19 W Center St
- 25 W Center St
- 1 N Main St
- 29 W Center St
- 0 N Main St Unit 164677
- 73 N Main St
- 38 W Center St
- 71 W Center St
- 18 E Center St
- 24 S Main St
- 87 W Center St
- 60 W 100 N
- 22 E Center St
- 56 W 100 N
- 64 W 100 N
- 99 W Center St