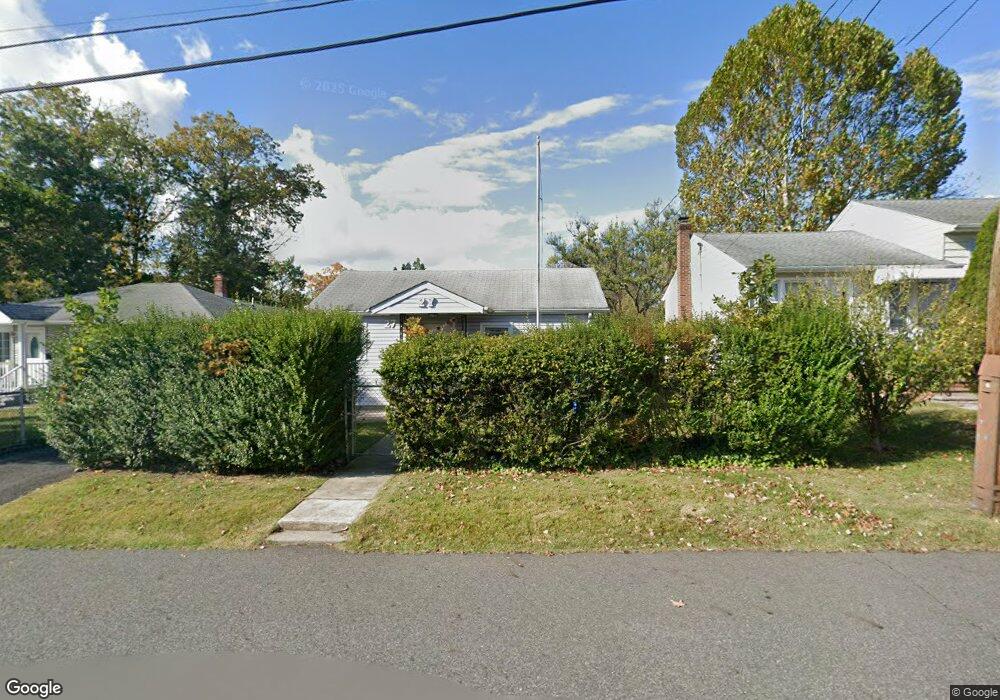
27 N Oak Ave Iselin, NJ 08830
Estimated Value: $340,590 - $530,000
--
Bed
--
Bath
1,080
Sq Ft
$429/Sq Ft
Est. Value
About This Home
This home is located at 27 N Oak Ave, Iselin, NJ 08830 and is currently estimated at $463,648, approximately $429 per square foot. 27 N Oak Ave is a home located in Middlesex County with nearby schools including Indiana Avenue School, Iselin Middle School, and John F. Kennedy Memorial High School.
Ownership History
Date
Name
Owned For
Owner Type
Purchase Details
Closed on
Oct 26, 2005
Sold by
Mikolaiski Vsevolod
Bought by
Varadharajan Gopinath and Gopinath Radharukmani
Current Estimated Value
Home Financials for this Owner
Home Financials are based on the most recent Mortgage that was taken out on this home.
Original Mortgage
$268,000
Outstanding Balance
$147,111
Interest Rate
6.07%
Estimated Equity
$316,537
Purchase Details
Closed on
Jul 2, 2003
Sold by
Hryniuk Michael
Bought by
Mikolaiski Vsevolod and Mikolaiski Natalia
Create a Home Valuation Report for This Property
The Home Valuation Report is an in-depth analysis detailing your home's value as well as a comparison with similar homes in the area
Home Values in the Area
Average Home Value in this Area
Purchase History
| Date | Buyer | Sale Price | Title Company |
|---|---|---|---|
| Varadharajan Gopinath | $335,000 | -- | |
| Mikolaiski Vsevolod | -- | -- |
Source: Public Records
Mortgage History
| Date | Status | Borrower | Loan Amount |
|---|---|---|---|
| Open | Varadharajan Gopinath | $268,000 |
Source: Public Records
Tax History Compared to Growth
Tax History
| Year | Tax Paid | Tax Assessment Tax Assessment Total Assessment is a certain percentage of the fair market value that is determined by local assessors to be the total taxable value of land and additions on the property. | Land | Improvement |
|---|---|---|---|---|
| 2025 | $8,491 | $70,300 | $17,400 | $52,900 |
| 2024 | $8,309 | $70,300 | $17,400 | $52,900 |
| 2023 | $8,309 | $70,300 | $17,400 | $52,900 |
| 2022 | $8,106 | $70,300 | $17,400 | $52,900 |
| 2021 | $8,029 | $70,300 | $17,400 | $52,900 |
| 2020 | $7,785 | $70,300 | $17,400 | $52,900 |
| 2019 | $7,594 | $70,300 | $17,400 | $52,900 |
| 2018 | $7,445 | $70,300 | $17,400 | $52,900 |
| 2017 | $7,312 | $70,300 | $17,400 | $52,900 |
| 2016 | $7,251 | $70,300 | $17,400 | $52,900 |
| 2015 | $7,128 | $70,300 | $17,400 | $52,900 |
| 2014 | $6,974 | $70,300 | $17,400 | $52,900 |
Source: Public Records
Map
Nearby Homes