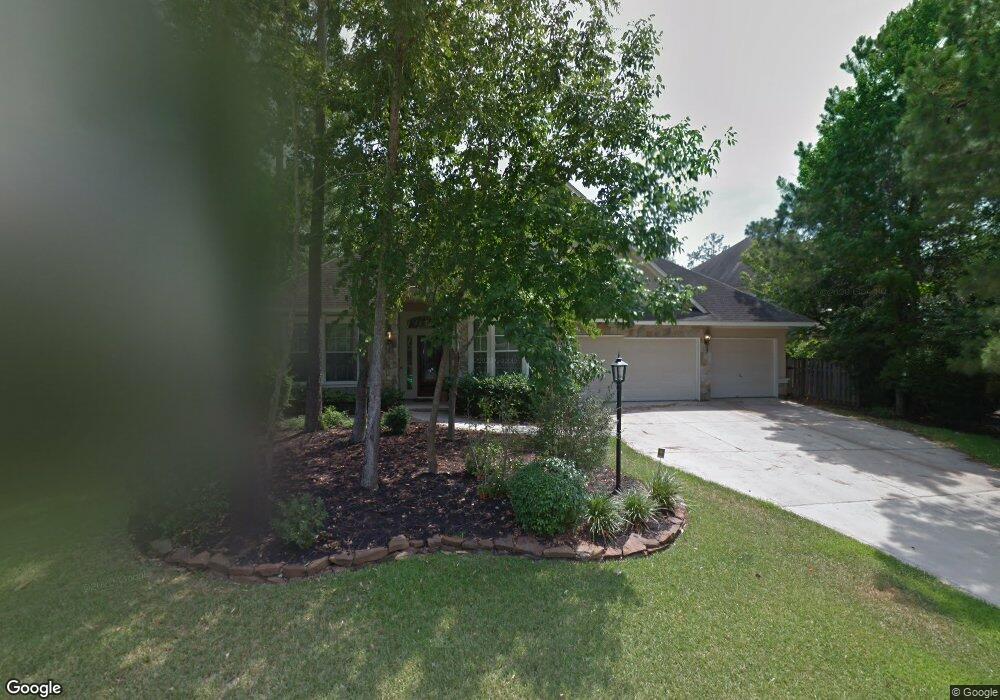
27 N Plum Crest Cir Spring, TX 77382
Alden Bridge NeighborhoodEstimated Value: $710,000 - $789,000
5
Beds
4
Baths
3,381
Sq Ft
$223/Sq Ft
Est. Value
About This Home
This home is located at 27 N Plum Crest Cir, Spring, TX 77382 and is currently estimated at $754,976, approximately $223 per square foot. 27 N Plum Crest Cir is a home located in Montgomery County with nearby schools including Buckalew Elementary School, Mitchell Intermediate School, and McCullough Junior High School.
Ownership History
Date
Name
Owned For
Owner Type
Purchase Details
Closed on
Aug 31, 2010
Sold by
Prudential Relocation Inc
Bought by
Barths Timothy C and Barths Katherine L
Current Estimated Value
Home Financials for this Owner
Home Financials are based on the most recent Mortgage that was taken out on this home.
Original Mortgage
$225,000
Outstanding Balance
$149,627
Interest Rate
4.58%
Mortgage Type
Purchase Money Mortgage
Estimated Equity
$605,349
Purchase Details
Closed on
Dec 22, 2004
Sold by
Hunt Ian R and Hunt Emily J
Bought by
Borths Timothy C and Borths Katherine L
Purchase Details
Closed on
Feb 17, 2000
Sold by
Life Forms Inc
Bought by
Hunt Ian R
Home Financials for this Owner
Home Financials are based on the most recent Mortgage that was taken out on this home.
Original Mortgage
$224,950
Interest Rate
8.16%
Create a Home Valuation Report for This Property
The Home Valuation Report is an in-depth analysis detailing your home's value as well as a comparison with similar homes in the area
Home Values in the Area
Average Home Value in this Area
Purchase History
| Date | Buyer | Sale Price | Title Company |
|---|---|---|---|
| Barths Timothy C | -- | Fidelity National Title | |
| Prudential Relocation Inc | -- | Fidelity National Title | |
| Borths Timothy C | -- | -- | |
| Hunt Ian R | -- | American Title Co |
Source: Public Records
Mortgage History
| Date | Status | Borrower | Loan Amount |
|---|---|---|---|
| Open | Prudential Relocation Inc | $225,000 | |
| Closed | Barths Timothy C | $244,800 | |
| Previous Owner | Hunt Ian R | $224,950 |
Source: Public Records
Tax History Compared to Growth
Tax History
| Year | Tax Paid | Tax Assessment Tax Assessment Total Assessment is a certain percentage of the fair market value that is determined by local assessors to be the total taxable value of land and additions on the property. | Land | Improvement |
|---|---|---|---|---|
| 2025 | $8,953 | $605,000 | $100,000 | $505,000 |
| 2024 | $8,108 | $585,640 | -- | -- |
| 2023 | $8,108 | $532,400 | $100,000 | $526,690 |
| 2022 | $9,810 | $484,000 | $100,000 | $418,000 |
| 2021 | $9,597 | $440,000 | $59,140 | $380,860 |
| 2020 | $10,327 | $430,000 | $59,140 | $370,860 |
| 2019 | $9,881 | $414,000 | $59,140 | $354,860 |
| 2018 | $8,496 | $395,150 | $59,140 | $336,010 |
| 2017 | $10,158 | $420,430 | $59,140 | $361,290 |
| 2016 | $9,422 | $390,000 | $59,140 | $330,860 |
| 2015 | $8,808 | $388,900 | $59,140 | $329,760 |
| 2014 | $8,808 | $370,260 | $59,140 | $317,720 |
Source: Public Records
Map
Nearby Homes
- 122 N Westwinds Cir
- 135 S Bluff Creek Cir
- 27 N Terrace Mill Cir
- 66 N Brooksedge Cir
- 19 Almond Branch Place
- 22 Almond Branch Place
- 6 Marquise Oaks Place
- 3 Broadweather Place
- 15 Forest Perch Place
- 183 Shale Run Place
- 6 Cloud Bank Place
- 35 Dewdrift Place
- 7 Ivy Castle Ct
- 11 Lyreleaf Place
- 18 Hidden Meadow Dr
- 32814 Westwood Square Dr E
- 2 Knights Crossing Dr
- 71 S Fair Manor Cir
- 114 S Knights Crossing Dr
- 88 W Grand Regency Cir
- 31 N Plum Crest Cir
- 30 Sunspree Place
- 19 N Plum Crest Cir
- 34 Sunspree Place
- 26 N Plum Crest Cir
- 26 Sunspree Place
- 35 N Plum Crest Cir
- 30 N Plum Crest Cir
- 22 N Plum Crest Cir
- 2 Petaldrop Place
- 15 N Plum Crest Cir
- 18 N Plum Crest Cir
- 39 S Plum Crest Cir
- 22 Sunspree Place
- 38 Sunspree Place
- 14 N Plum Crest Cir
- 11 N Plum Crest Cir
- 43 S Plum Crest Cir
- 6 Petaldrop Place
- 14 Sunspree Place