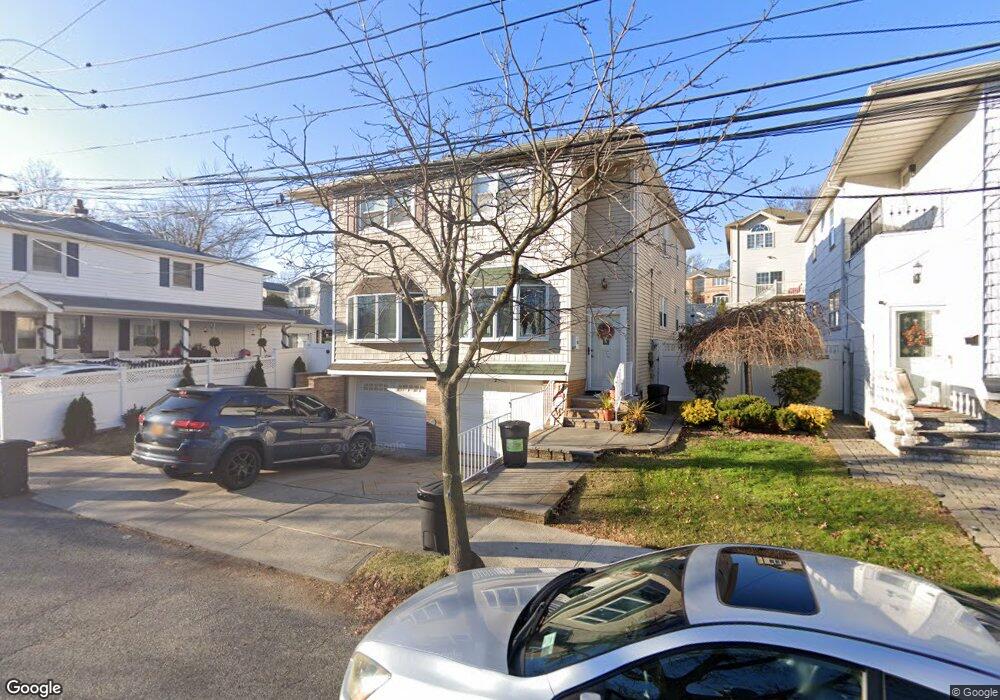
27 Nash Ct Staten Island, NY 10308
Great Kills NeighborhoodEstimated Value: $653,518 - $752,000
3
Beds
2
Baths
1,500
Sq Ft
$481/Sq Ft
Est. Value
About This Home
This home is located at 27 Nash Ct, Staten Island, NY 10308 and is currently estimated at $720,880, approximately $480 per square foot. 27 Nash Ct is a home located in Richmond County with nearby schools including P.S. 8 Shirlee Solomon, Myra S. Barnes Intermediate School 24, and New Dorp High School.
Ownership History
Date
Name
Owned For
Owner Type
Purchase Details
Closed on
Aug 28, 2010
Sold by
Belmonte Carmine and Belmonte Frances
Bought by
Belmonte Frances
Current Estimated Value
Purchase Details
Closed on
Sep 10, 2001
Sold by
Tafuri Michele
Bought by
Belmonte Carmine and Belmonte Frances
Home Financials for this Owner
Home Financials are based on the most recent Mortgage that was taken out on this home.
Original Mortgage
$210,000
Interest Rate
6.98%
Create a Home Valuation Report for This Property
The Home Valuation Report is an in-depth analysis detailing your home's value as well as a comparison with similar homes in the area
Home Values in the Area
Average Home Value in this Area
Purchase History
| Date | Buyer | Sale Price | Title Company |
|---|---|---|---|
| Belmonte Frances | $52,500 | None Available | |
| Belmonte Carmine | $274,000 | United General Title Ins Co |
Source: Public Records
Mortgage History
| Date | Status | Borrower | Loan Amount |
|---|---|---|---|
| Previous Owner | Belmonte Carmine | $210,000 |
Source: Public Records
Tax History Compared to Growth
Tax History
| Year | Tax Paid | Tax Assessment Tax Assessment Total Assessment is a certain percentage of the fair market value that is determined by local assessors to be the total taxable value of land and additions on the property. | Land | Improvement |
|---|---|---|---|---|
| 2025 | $2,653 | $36,060 | $5,771 | $30,289 |
| 2024 | $2,665 | $35,640 | $5,508 | $30,132 |
| 2023 | $2,514 | $27,562 | $5,019 | $22,543 |
| 2022 | $2,464 | $32,040 | $6,720 | $25,320 |
| 2021 | $2,575 | $32,880 | $6,720 | $26,160 |
| 2020 | $2,435 | $31,560 | $6,720 | $24,840 |
| 2019 | $2,459 | $33,180 | $6,720 | $26,460 |
| 2018 | $4,384 | $22,968 | $4,881 | $18,087 |
| 2017 | $4,382 | $22,968 | $5,927 | $17,041 |
| 2016 | $4,247 | $22,795 | $6,197 | $16,598 |
| 2015 | $3,588 | $21,505 | $5,305 | $16,200 |
| 2014 | $3,588 | $20,288 | $4,965 | $15,323 |
Source: Public Records
Map
Nearby Homes
- 23 Melrose Place
- 71 Grandview Terrace
- 76 Whitman Ave
- 268 Nelson Ave
- 31 Hillcrest St
- 309 Cleveland Ave
- 241 Lindenwood Rd
- 177 Hillside Terrace
- 249 Lindenwood Rd
- 69 Hillcrest Ave
- 346 Cleveland Ave
- 9 Russell St
- 4028 Hylan Blvd
- 289 Maybury Ave
- 111 David St
- 42 Acacia Ave
- 0 Dent Rd
- 142 Great Kills Rd Unit A
- 4 Waterside Pkwy
- 103 Acacia Ave
- 29 Nash Ct
- 23 Nash Ct
- 21 Nash Ct
- 33 Nash Ct
- 17 Nash Ct
- 94 Monticello Terrace
- 90 Monticello Terrace
- 15 Nash Ct
- 96 Monticello Terrace
- 88 Monticello Terrace
- 88 Monticello Terrace
- 39 Nash Ct
- 100 Monticello Terrace
- 100 Monticello Terrace
- 84 Monticello Terrace
- 11 Nash Ct
- 82 Monticello Terrace
- 102 Monticello Terrace
- 9 Nash Ct
- 24 Nash Ct