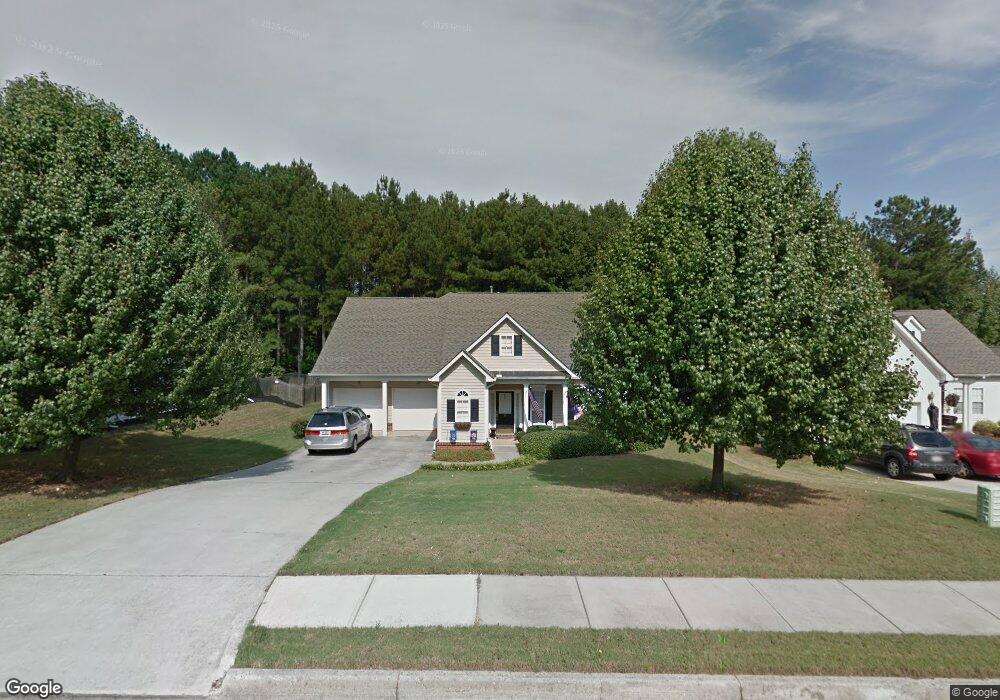
27 Oak Shores Dr Newnan, GA 30265
Summergrove NeighborhoodEstimated Value: $433,676 - $460,000
3
Beds
3
Baths
2,614
Sq Ft
$171/Sq Ft
Est. Value
About This Home
This home is located at 27 Oak Shores Dr, Newnan, GA 30265 and is currently estimated at $446,419, approximately $170 per square foot. 27 Oak Shores Dr is a home located in Coweta County with nearby schools including Welch Elementary School, Lee Middle School, and East Coweta High School.
Ownership History
Date
Name
Owned For
Owner Type
Purchase Details
Closed on
Mar 3, 2003
Sold by
Hardman Homes Inc
Bought by
Trammell Alexander and Trammell Suzanne
Current Estimated Value
Home Financials for this Owner
Home Financials are based on the most recent Mortgage that was taken out on this home.
Original Mortgage
$73,710
Outstanding Balance
$31,430
Interest Rate
5.89%
Mortgage Type
New Conventional
Estimated Equity
$414,989
Purchase Details
Closed on
Feb 28, 2003
Sold by
Jerry Ballard Homes Inc
Bought by
Rivers Russell M and Rivers Victoria P
Home Financials for this Owner
Home Financials are based on the most recent Mortgage that was taken out on this home.
Original Mortgage
$73,710
Outstanding Balance
$31,430
Interest Rate
5.89%
Mortgage Type
New Conventional
Estimated Equity
$414,989
Purchase Details
Closed on
Mar 28, 2002
Sold by
Peachtree City Holdings
Bought by
Jerry Ballard Homes Inc
Purchase Details
Closed on
Jun 17, 1999
Bought by
Peachtree City Holdings
Create a Home Valuation Report for This Property
The Home Valuation Report is an in-depth analysis detailing your home's value as well as a comparison with similar homes in the area
Home Values in the Area
Average Home Value in this Area
Purchase History
| Date | Buyer | Sale Price | Title Company |
|---|---|---|---|
| Trammell Alexander | $81,900 | -- | |
| Rivers Russell M | $204,000 | -- | |
| Jerry Ballard Homes Inc | $272,100 | -- | |
| Peachtree City Holdings | $1,023,000 | -- |
Source: Public Records
Mortgage History
| Date | Status | Borrower | Loan Amount |
|---|---|---|---|
| Open | Trammell Alexander | $73,710 | |
| Open | Rivers Russell M | $183,600 |
Source: Public Records
Tax History Compared to Growth
Tax History
| Year | Tax Paid | Tax Assessment Tax Assessment Total Assessment is a certain percentage of the fair market value that is determined by local assessors to be the total taxable value of land and additions on the property. | Land | Improvement |
|---|---|---|---|---|
| 2025 | $4,033 | $167,889 | $32,000 | $135,889 |
| 2024 | $3,676 | $160,880 | $32,000 | $128,880 |
| 2023 | $3,676 | $165,251 | $28,000 | $137,251 |
| 2022 | $3,409 | $140,108 | $28,000 | $112,108 |
| 2021 | $3,118 | $115,998 | $24,000 | $91,998 |
| 2020 | $3,188 | $115,998 | $24,000 | $91,998 |
| 2019 | $3,104 | $103,339 | $18,000 | $85,339 |
| 2018 | $3,123 | $103,339 | $18,000 | $85,339 |
| 2017 | $2,910 | $96,724 | $18,000 | $78,724 |
| 2016 | $2,653 | $88,124 | $18,000 | $70,124 |
| 2015 | $2,498 | $82,831 | $18,000 | $64,831 |
| 2014 | $2,587 | $82,831 | $18,000 | $64,831 |
Source: Public Records
Map
Nearby Homes
- 15 Oak Shores Dr
- 30 Oak Shores Dr
- 425 Lake Forest Dr
- 111 Portico Place
- 41 Briar Grove
- 64 Gables Way
- 43 Beacon Crest
- 21 Oak Park Square
- 41 Corbel Way
- 5 Corbel Way
- 3 Briar Grove
- 100 Arbor Way
- 15 Downing Ct
- 31 The Promenade
- 69 Arbor Way
- 70 High Point North Dr
- 185 Pine Crescent
- 7 High Point Cir
- 39 Rollingbrook Vista
- 173 Freeman Forest Dr
- 21 Oak Shores Dr
- 33 Oak Shores Dr
- 39 Oak Shores Dr
- 45 Oak Shores Dr
- 22 Oak Shores Dr
- 1 Hidden Woods Ln
- 2 Hidden Woods Ln
- 364 Lake Forest Dr
- 16 Oak Shores Dr
- 354 Lake Forest Dr
- 51 Oak Shores Dr
- 344 Lake Forest Dr
- 44 Oak Shores Dr
- 0 Lake Shore Dr Unit 35 7058850
- 55 Park Forest Curve
- 3 Hidden Woods Ln
- 380 Lake Forest Dr
- 6 Hidden Woods Ln
- 336 Lake Forest Dr
- 115 Oak Park Square