27 Ocean Front St Scituate, MA 02047
Humarock NeighborhoodEstimated Value: $986,000 - $1,168,000
2
Beds
1
Bath
1,008
Sq Ft
$1,089/Sq Ft
Est. Value
About This Home
This home is located at 27 Ocean Front St, Scituate, MA 02047 and is currently estimated at $1,097,221, approximately $1,088 per square foot. 27 Ocean Front St is a home located in Plymouth County.
Ownership History
Date
Name
Owned For
Owner Type
Purchase Details
Closed on
Dec 31, 2020
Sold by
Thomas B Obrien T B and Thomas Obrien
Bought by
Keltic Realty Llc
Current Estimated Value
Purchase Details
Closed on
Mar 16, 2016
Sold by
Obrien Ruth M and Obrien
Bought by
Obrien Thomas B and Obrien Ruth M
Purchase Details
Closed on
Feb 11, 2008
Sold by
Obrien T Barry T and Obrien Ruth M
Bought by
Obrien Rt and Obrien
Create a Home Valuation Report for This Property
The Home Valuation Report is an in-depth analysis detailing your home's value as well as a comparison with similar homes in the area
Home Values in the Area
Average Home Value in this Area
Purchase History
| Date | Buyer | Sale Price | Title Company |
|---|---|---|---|
| Keltic Realty Llc | -- | None Available | |
| Keltic Realty Llc | -- | None Available | |
| Obrien Thomas B | -- | -- | |
| Thomas B Obrien T B | -- | -- | |
| Obrien Thomas B | -- | -- | |
| Obrien Ruth M | -- | -- | |
| Obrien Rt | -- | -- | |
| Obrien Rt | -- | -- |
Source: Public Records
Mortgage History
| Date | Status | Borrower | Loan Amount |
|---|---|---|---|
| Previous Owner | Obrien Rt | $233,000 |
Source: Public Records
Tax History
| Year | Tax Paid | Tax Assessment Tax Assessment Total Assessment is a certain percentage of the fair market value that is determined by local assessors to be the total taxable value of land and additions on the property. | Land | Improvement |
|---|---|---|---|---|
| 2025 | $10,123 | $1,013,300 | $557,400 | $455,900 |
| 2024 | $9,412 | $908,500 | $471,800 | $436,700 |
| 2023 | $8,767 | $839,900 | $428,900 | $411,000 |
| 2022 | $8,767 | $694,700 | $350,200 | $344,500 |
| 2021 | $8,570 | $642,900 | $333,500 | $309,400 |
| 2020 | $8,469 | $627,300 | $332,500 | $294,800 |
| 2019 | $8,355 | $608,100 | $326,000 | $282,100 |
| 2018 | $8,122 | $582,200 | $328,600 | $253,600 |
| 2017 | $7,780 | $552,200 | $308,700 | $243,500 |
| 2016 | $7,527 | $532,300 | $288,800 | $243,500 |
| 2015 | $6,842 | $522,300 | $278,800 | $243,500 |
Source: Public Records
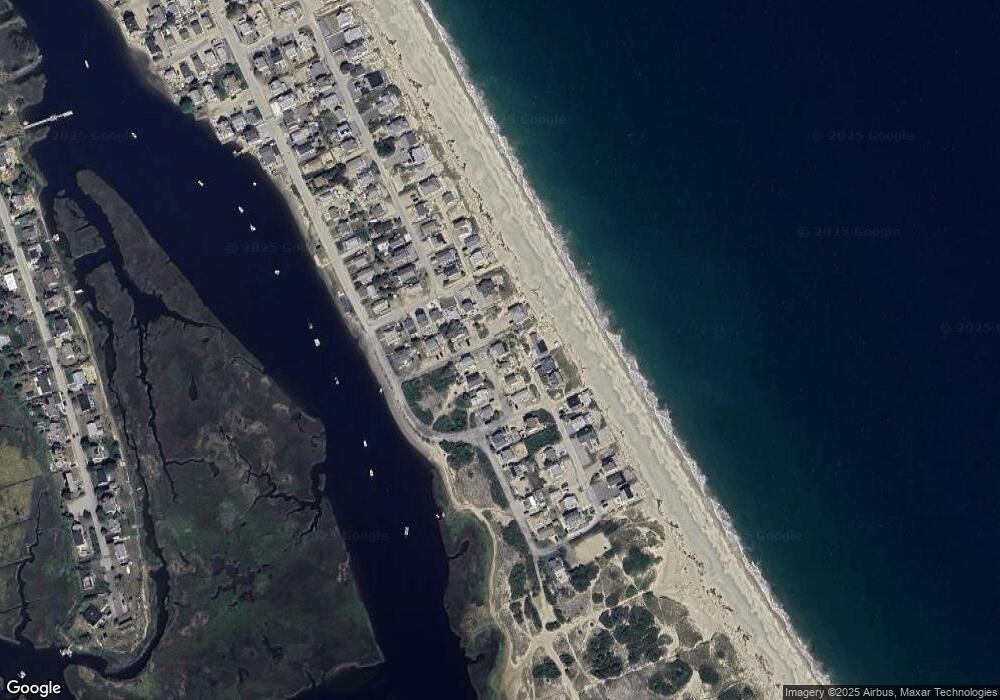
Map
Nearby Homes
- 255 Ridge Rd
- 1192 S River St
- 566 Holly Rd
- 86 Telegraph Hill Rd
- 16 Schooner Way
- 10 Spyglass Landing Dr
- 155 Quincy Ave
- 4 Summer St
- 3 Summer St
- 39 High Beacon Way
- 85 Constitution Rd
- 1 John St
- 316 Summer St
- 30 Chandler Dr
- 92 Salt Meadow Waye
- 7 Pierce Rd
- 97 Wrights Way
- 290 S River St
- 14 Ferry St
- 42 Carr Rd
- 27 Ocean Dr
- 7 Dream Way
- 5 Dream Way
- 3 Dream Way
- 14 Alden St
- 3 Court St
- 3 Court St
- 20 Ocean Front St
- 000 Ocean
- 2 Court St
- 21 Alden St
- 21 Alden St Unit 21
- 21 Alden St Unit 1
- 49 River Street(winter Rental)
- 171 River St
- 11 Old Mouth Rd
- 2 Alden Ave
- 20 Humarock Beach Unit 1
- 20 Humarock Beach
- 13 Old Mouth Rd
Your Personal Tour Guide
Ask me questions while you tour the home.