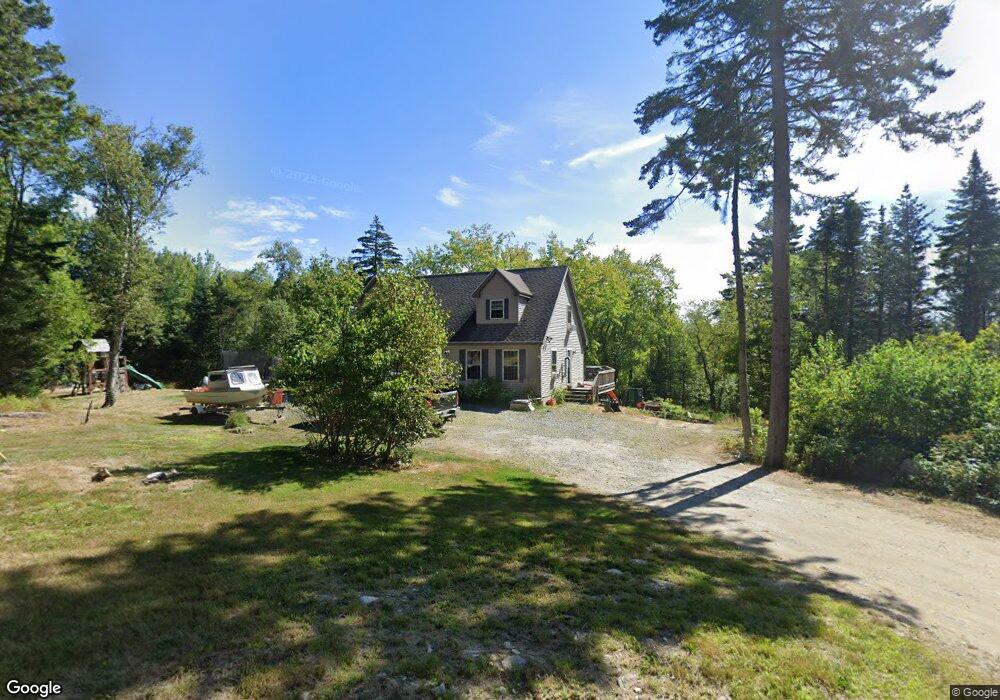
27 Old County Rd MacHiasport, ME 04655
Estimated Value: $297,000 - $448,000
5
Beds
3
Baths
2,156
Sq Ft
$158/Sq Ft
Est. Value
About This Home
This home is located at 27 Old County Rd, MacHiasport, ME 04655 and is currently estimated at $341,396, approximately $158 per square foot. 27 Old County Rd is a home with nearby schools including Fort O'Brien School, Machias Valley Christian School, and Washington Academy.
Ownership History
Date
Name
Owned For
Owner Type
Purchase Details
Closed on
Nov 10, 2022
Sold by
Heniser Bethany
Bought by
Rolfe Cady and Gray Ryley
Current Estimated Value
Home Financials for this Owner
Home Financials are based on the most recent Mortgage that was taken out on this home.
Original Mortgage
$237,500
Outstanding Balance
$230,095
Interest Rate
6.92%
Mortgage Type
Purchase Money Mortgage
Estimated Equity
$111,301
Purchase Details
Closed on
Aug 12, 2013
Sold by
Garcia Joseph A and Garcia Nicole M
Bought by
Johnson Bethany E
Home Financials for this Owner
Home Financials are based on the most recent Mortgage that was taken out on this home.
Original Mortgage
$240,816
Interest Rate
4.45%
Mortgage Type
Commercial
Purchase Details
Closed on
Aug 28, 2006
Sold by
Huntley Allan W and Huntley Linda M
Bought by
Garcia Joseph A and Garcia Nicole M
Create a Home Valuation Report for This Property
The Home Valuation Report is an in-depth analysis detailing your home's value as well as a comparison with similar homes in the area
Home Values in the Area
Average Home Value in this Area
Purchase History
| Date | Buyer | Sale Price | Title Company |
|---|---|---|---|
| Rolfe Cady | $250,000 | None Available | |
| Johnson Bethany E | -- | -- | |
| Garcia Joseph A | -- | -- |
Source: Public Records
Mortgage History
| Date | Status | Borrower | Loan Amount |
|---|---|---|---|
| Open | Rolfe Cady | $237,500 | |
| Previous Owner | Johnson Bethany E | $240,816 |
Source: Public Records
Tax History Compared to Growth
Tax History
| Year | Tax Paid | Tax Assessment Tax Assessment Total Assessment is a certain percentage of the fair market value that is determined by local assessors to be the total taxable value of land and additions on the property. | Land | Improvement |
|---|---|---|---|---|
| 2024 | $2,839 | $218,370 | $25,930 | $192,440 |
| 2023 | $2,557 | $202,920 | $23,930 | $178,990 |
| 2022 | $2,305 | $187,420 | $22,840 | $164,580 |
| 2021 | $2,043 | $187,420 | $22,840 | $164,580 |
| 2020 | $2,343 | $187,420 | $22,840 | $164,580 |
| 2019 | $2,013 | $117,045 | $21,552 | $95,493 |
| 2018 | $2,145 | $115,972 | $21,552 | $94,420 |
| 2017 | $2,048 | $117,045 | $21,552 | $95,493 |
| 2016 | $2,048 | $117,045 | $21,552 | $95,493 |
| 2015 | $2,150 | $118,118 | $21,552 | $96,566 |
| 2014 | $1,875 | $103,042 | $21,552 | $81,490 |
| 2013 | $1,838 | $101,529 | $21,552 | $79,977 |
Source: Public Records
Map
Nearby Homes
- 4-28 Old Town Rd Old County Rd Rd
- 33 Corn Hill Rd
- 37 Corn Hill Rd
- 366 Port Rd
- 576 Port Rd
- 21-5-3 E Palmer Rd
- 12 W Palmer Rd
- MarkayEast Puffins Ln
- 1 Puffins Ln
- 76 Dunns Point Way
- 85 E Side Rd
- 80 Holmes Way
- 379 Cutler Rd
- 321 Cutler Rd
- 285 & 291 Cutler Rd
- 191 Route 191 N
- 65 Lookout Mountain Rd
- 9 Tupper Ln
- 780 Cutler Rd
- 787 Cutler Rd
- 17 Old County Rd
- 36 Old County Rd
- 41 Old County Rd
- 0 Old County Rd Unit 836230
- 0 Old County Rd Unit 1421758
- 0 Old County Rd Unit 1268133
- 11 Old County Rd
- 15 Old County Rd
- 10 Old County Rd
- 48 Old County Rd
- 33 Corn Hill
- 395 Port Rd
- 397 Port Rd
- 393 Port Rd
- 410 Port Rd
- 402 Port Rd
- 409 Port Rd
- 50 Corn Hill
- 389 Port Rd
- 417 Port Rd