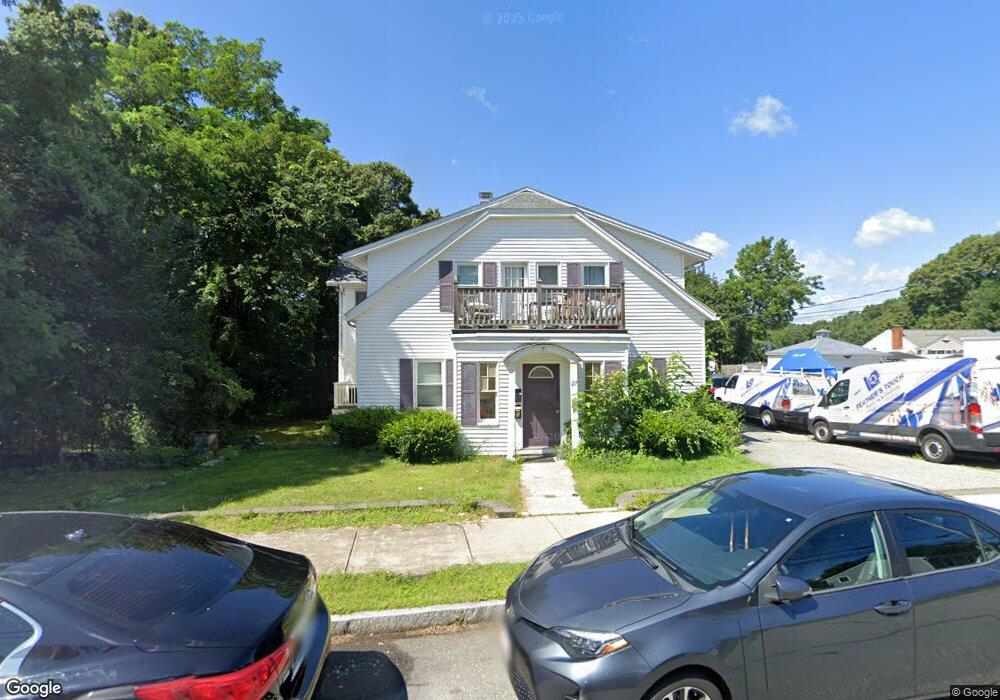
27 Orange St Unit 2 Woburn, MA 01801
Walnut Hill NeighborhoodEstimated Value: $856,000 - $932,000
3
Beds
1
Bath
1,400
Sq Ft
$639/Sq Ft
Est. Value
About This Home
This home is located at 27 Orange St Unit 2, Woburn, MA 01801 and is currently estimated at $894,100, approximately $638 per square foot. 27 Orange St Unit 2 is a home located in Middlesex County with nearby schools including Goodyear Elementary School, John F. Kennedy Middle School, and Woburn High School.
Ownership History
Date
Name
Owned For
Owner Type
Purchase Details
Closed on
Aug 27, 2018
Sold by
Tong Xiaobing and Xiang Mengyi
Bought by
Tong Xiaobing and Xiang Mengyi
Current Estimated Value
Purchase Details
Closed on
Jun 10, 2015
Sold by
Tong Xiaobing and Xiang Mengyi
Bought by
Tong Xiaobing and Xiang Mengyi
Purchase Details
Closed on
Apr 26, 2013
Sold by
Dockside Props Llc
Bought by
Tong Xiaobing and Xiang Mengyi
Purchase Details
Closed on
Jan 17, 2013
Sold by
Mondi Allison and Hsbc Bank Usa Na
Bought by
Claridge Corp
Home Financials for this Owner
Home Financials are based on the most recent Mortgage that was taken out on this home.
Original Mortgage
$215,000
Interest Rate
3.39%
Mortgage Type
New Conventional
Create a Home Valuation Report for This Property
The Home Valuation Report is an in-depth analysis detailing your home's value as well as a comparison with similar homes in the area
Home Values in the Area
Average Home Value in this Area
Purchase History
| Date | Buyer | Sale Price | Title Company |
|---|---|---|---|
| Tong Xiaobing | -- | -- | |
| Tong Xiaobing | -- | -- | |
| Tong Xiaobing | -- | -- | |
| Tong Xiaobing | -- | -- | |
| Tong Xiaobing | $310,500 | -- | |
| Claridge Corp | $216,000 | -- | |
| Dockside Props Llc | -- | -- | |
| Claridge Corp | $216,000 | -- |
Source: Public Records
Mortgage History
| Date | Status | Borrower | Loan Amount |
|---|---|---|---|
| Previous Owner | Claridge Corp | $215,000 | |
| Previous Owner | Claridge Corp | $269,500 |
Source: Public Records
Tax History Compared to Growth
Tax History
| Year | Tax Paid | Tax Assessment Tax Assessment Total Assessment is a certain percentage of the fair market value that is determined by local assessors to be the total taxable value of land and additions on the property. | Land | Improvement |
|---|---|---|---|---|
| 2025 | $6,420 | $751,800 | $341,200 | $410,600 |
| 2024 | $5,847 | $725,400 | $325,200 | $400,200 |
| 2023 | $5,903 | $678,500 | $295,700 | $382,800 |
| 2022 | $5,594 | $598,900 | $257,900 | $341,000 |
| 2021 | $5,476 | $586,900 | $245,900 | $341,000 |
| 2020 | $4,982 | $534,600 | $245,900 | $288,700 |
| 2019 | $7,155 | $485,600 | $234,500 | $251,100 |
| 2018 | $4,558 | $460,900 | $215,600 | $245,300 |
| 2017 | $4,109 | $413,400 | $205,700 | $207,700 |
| 2016 | $3,855 | $383,600 | $192,600 | $191,000 |
| 2015 | $3,777 | $371,400 | $180,400 | $191,000 |
| 2014 | $3,360 | $321,800 | $180,400 | $141,400 |
Source: Public Records
Map
Nearby Homes
- 18 Central St
- 18 Carmen Terrace
- 3 Frank St
- 35 Grape St
- 6 Stratton Dr Unit 404
- 6 Stratton Dr Unit 410
- 3 Laurel St
- 295 Salem St Unit 69
- 2 Mason Way Unit 6524
- 6 Mason Way Unit 6324
- 19 Mason Way Unit 75
- 10 Mason Way Unit 61
- 2 Archer Dr Unit 1
- 51 Vernon St
- 2 Stratton Dr Unit 1109
- 200 Ledgewood Dr Unit 505
- 100 Ledgewood Dr Unit 417
- 100 Ledgewood Dr Unit 618
- 1 Boline Place
- 18 Gardner Ave
- 27 Orange St
- 27 Orange St Unit A
- 30 Orange St
- 32 Orange St Unit 32
- 34 Orange St
- 34 Orange St Unit 1
- 34 Orange St Unit 34
- 28 Orange St
- 33 Orange St
- 25 Orange St
- 26 Orange St
- 27 Hawthorne St Unit A
- 4 Carter Rd
- 24 Orange St
- 2 Carter Rd
- 23 Orange St
- 23 Orange St Unit R
- 22 Orange St
- 7 Central St
- 21 Orange St