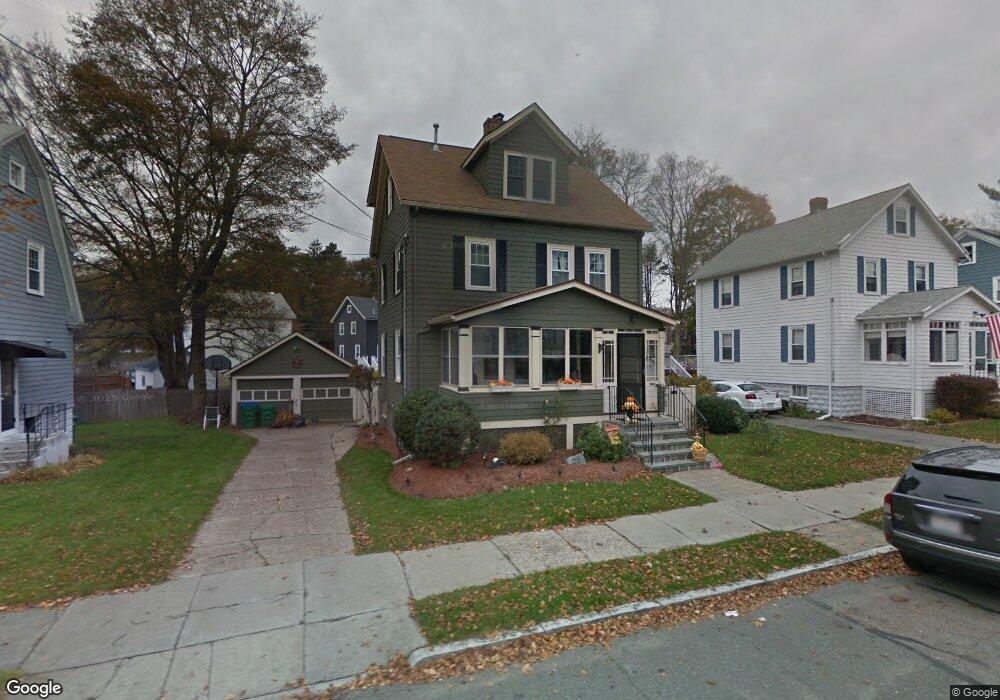
27 Osborne Rd Medford, MA 02155
West Medford NeighborhoodEstimated Value: $916,807 - $1,043,000
4
Beds
3
Baths
1,716
Sq Ft
$569/Sq Ft
Est. Value
About This Home
This home is located at 27 Osborne Rd, Medford, MA 02155 and is currently estimated at $977,202, approximately $569 per square foot. 27 Osborne Rd is a home located in Middlesex County with nearby schools including Medford High School, Saint Raphael School, and St. Joseph School.
Ownership History
Date
Name
Owned For
Owner Type
Purchase Details
Closed on
Jul 29, 2024
Sold by
Moore James M and Moore Valarie J
Bought by
James M & V J Moore Ret and Moore
Current Estimated Value
Purchase Details
Closed on
Dec 24, 1997
Sold by
Fitzgerald Chester W
Bought by
Moore James M and Moore Valarie J
Create a Home Valuation Report for This Property
The Home Valuation Report is an in-depth analysis detailing your home's value as well as a comparison with similar homes in the area
Home Values in the Area
Average Home Value in this Area
Purchase History
| Date | Buyer | Sale Price | Title Company |
|---|---|---|---|
| James M & V J Moore Ret | -- | None Available | |
| James M & V J Moore Ret | -- | None Available | |
| Moore James M | $200,000 | -- | |
| Moore James M | $200,000 | -- |
Source: Public Records
Mortgage History
| Date | Status | Borrower | Loan Amount |
|---|---|---|---|
| Previous Owner | Moore James M | $40,000 | |
| Previous Owner | Moore James M | $236,800 |
Source: Public Records
Tax History Compared to Growth
Tax History
| Year | Tax Paid | Tax Assessment Tax Assessment Total Assessment is a certain percentage of the fair market value that is determined by local assessors to be the total taxable value of land and additions on the property. | Land | Improvement |
|---|---|---|---|---|
| 2025 | $7,252 | $824,100 | $459,800 | $364,300 |
| 2024 | $6,784 | $796,200 | $437,800 | $358,400 |
| 2023 | $6,452 | $745,900 | $409,200 | $336,700 |
| 2022 | $6,279 | $696,900 | $372,000 | $324,900 |
| 2021 | $6,087 | $646,900 | $354,300 | $292,600 |
| 2020 | $5,965 | $649,800 | $354,300 | $295,500 |
| 2019 | $5,717 | $595,500 | $322,000 | $273,500 |
| 2018 | $5,618 | $548,600 | $292,700 | $255,900 |
| 2017 | $5,472 | $518,200 | $273,600 | $244,600 |
| 2016 | $5,095 | $455,300 | $248,800 | $206,500 |
| 2015 | $4,923 | $420,800 | $236,900 | $183,900 |
Source: Public Records
Map
Nearby Homes
- 595 Winthrop St
- 19 Shirley Rd
- 545 Winthrop St Unit Lot 9
- 545 Winthrop St Unit Lot 7
- 545 Winthrop St Unit Lot D
- 9 Wildwood Rd
- 40 Century St
- 141 Brooks St
- 115 Warren St Unit 2
- 26 North Gateway
- 211 Grove St
- 19 Town Way
- 35 Grove St
- 5 Norwich Cir
- 39 Town Way
- 11 Whitney Rd
- 421 High St Unit 203
- 421 High St Unit 205
- 421 High St Unit 202
- 421 High St Unit 204