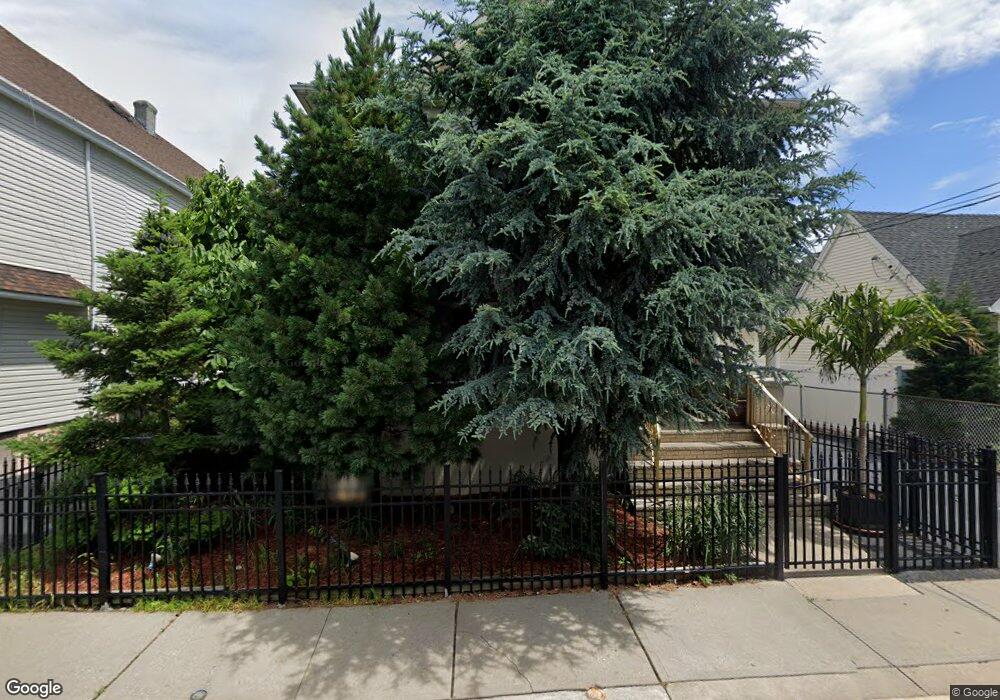
27 Park Row Wallington, NJ 07057
Estimated Value: $696,000 - $842,768
Studio
--
Bath
2,456
Sq Ft
$319/Sq Ft
Est. Value
About This Home
This home is located at 27 Park Row, Wallington, NJ 07057 and is currently estimated at $783,942, approximately $319 per square foot. 27 Park Row is a home located in Bergen County with nearby schools including Wallington Jr Sr High School and Mesivta Tiferes Rav Zvi Aryeh Zemel.
Ownership History
Date
Name
Owned For
Owner Type
Purchase Details
Closed on
Jan 18, 2001
Sold by
King Karen
Bought by
Royal Developers Llc
Current Estimated Value
Purchase Details
Closed on
Sep 21, 2000
Bought by
Torbus Bogdan
Home Financials for this Owner
Home Financials are based on the most recent Mortgage that was taken out on this home.
Original Mortgage
$100,000
Interest Rate
7.64%
Create a Home Valuation Report for This Property
The Home Valuation Report is an in-depth analysis detailing your home's value as well as a comparison with similar homes in the area
Home Values in the Area
Average Home Value in this Area
Purchase History
| Date | Buyer | Sale Price | Title Company |
|---|---|---|---|
| Royal Developers Llc | $160,000 | -- | |
| Royal Developers Llc | $160,000 | -- | |
| Torbus Bogdan | -- | -- | |
| Torbus Bogdan | -- | -- |
Source: Public Records
Mortgage History
| Date | Status | Borrower | Loan Amount |
|---|---|---|---|
| Previous Owner | Torbus Bogdan | $100,000 |
Source: Public Records
Tax History
| Year | Tax Paid | Tax Assessment Tax Assessment Total Assessment is a certain percentage of the fair market value that is determined by local assessors to be the total taxable value of land and additions on the property. | Land | Improvement |
|---|---|---|---|---|
| 2025 | $13,356 | $744,200 | $250,000 | $494,200 |
| 2024 | $12,849 | $392,700 | $150,000 | $242,700 |
| 2023 | $12,582 | $392,700 | $150,000 | $242,700 |
| 2022 | $12,582 | $392,700 | $150,000 | $242,700 |
| 2021 | $12,366 | $392,700 | $150,000 | $242,700 |
| 2020 | $12,115 | $392,700 | $150,000 | $242,700 |
| 2019 | $11,730 | $392,700 | $150,000 | $242,700 |
| 2018 | $11,593 | $392,700 | $150,000 | $242,700 |
| 2017 | $11,447 | $392,700 | $150,000 | $242,700 |
| 2016 | $11,632 | $407,000 | $150,000 | $257,000 |
| 2015 | $11,136 | $407,000 | $150,000 | $257,000 |
| 2014 | $10,566 | $407,000 | $150,000 | $257,000 |
Source: Public Records
Map
Nearby Homes
- 75 Midland Ave
- 39 Tuttle St
- 94 Locust Ave
- 121 Halstead Ave
- 84 Locust Ave
- 6 Hillside Terrace
- 80 Koster St
- 204 Hayward Place
- 104 Wallington Ave
- 70 Bogart Ave
- 12 Spencer Place
- 68 Leahy Dr Unit 4904
- 15 Wallington Ave
- 56 Passaic St
- 104 Hayward Place
- 60 Passaic St
- 106-110 Hayward Place
- 65 Marsellus Place
- 34 Arnold Dr
- 55 Passaic St
Your Personal Tour Guide
Ask me questions while you tour the home.