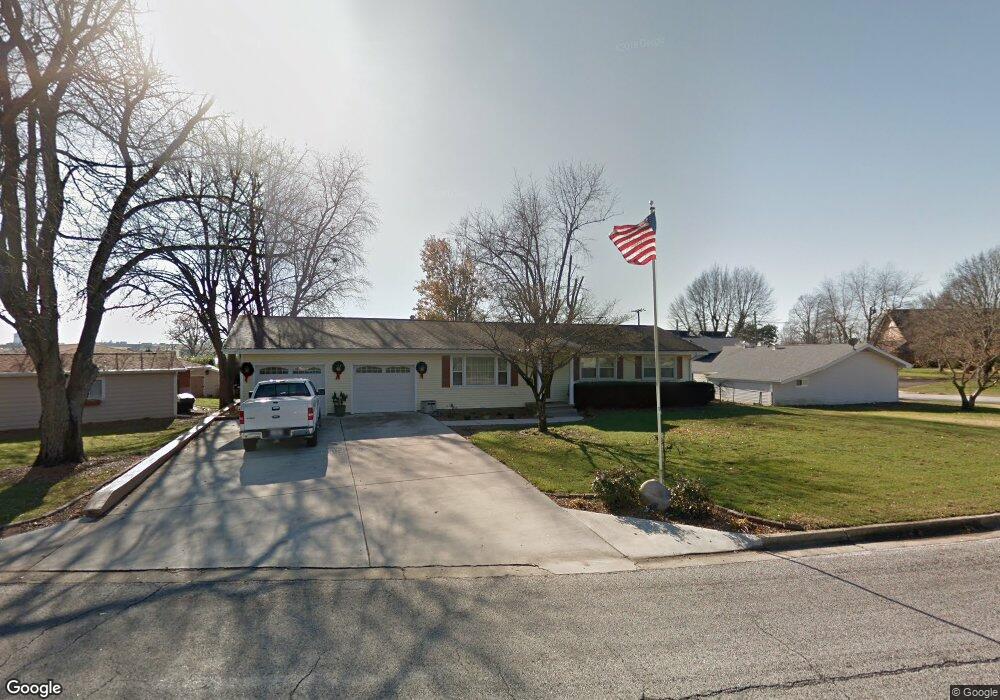
27 Permac Rd Jacksonville, IL 62650
Estimated Value: $193,000 - $226,693
--
Bed
--
Bath
1,538
Sq Ft
$135/Sq Ft
Est. Value
About This Home
This home is located at 27 Permac Rd, Jacksonville, IL 62650 and is currently estimated at $206,923, approximately $134 per square foot. 27 Permac Rd is a home located in Morgan County with nearby schools including Jacksonville High School and Westfair Christian Academy.
Ownership History
Date
Name
Owned For
Owner Type
Purchase Details
Closed on
Feb 11, 2024
Sold by
Leslie Ellen M and Leach Ellen M
Bought by
Leslie Michael L and Leslie Ellen M
Current Estimated Value
Purchase Details
Closed on
Apr 29, 2008
Sold by
Leach Ellen M
Bought by
Leach Ellen M and Leslie Michael L
Purchase Details
Closed on
May 31, 2006
Sold by
Wyatt Michael R and Wyatt Kelly J
Bought by
Leach Ellen M
Home Financials for this Owner
Home Financials are based on the most recent Mortgage that was taken out on this home.
Original Mortgage
$93,600
Interest Rate
6.62%
Mortgage Type
New Conventional
Create a Home Valuation Report for This Property
The Home Valuation Report is an in-depth analysis detailing your home's value as well as a comparison with similar homes in the area
Home Values in the Area
Average Home Value in this Area
Purchase History
| Date | Buyer | Sale Price | Title Company |
|---|---|---|---|
| Leslie Michael L | -- | None Listed On Document | |
| Leach Ellen M | -- | None Available | |
| Leach Ellen M | $117,000 | None Available |
Source: Public Records
Mortgage History
| Date | Status | Borrower | Loan Amount |
|---|---|---|---|
| Previous Owner | Leach Ellen M | $93,600 |
Source: Public Records
Tax History Compared to Growth
Tax History
| Year | Tax Paid | Tax Assessment Tax Assessment Total Assessment is a certain percentage of the fair market value that is determined by local assessors to be the total taxable value of land and additions on the property. | Land | Improvement |
|---|---|---|---|---|
| 2024 | $5,089 | $64,590 | $8,500 | $56,090 |
| 2023 | $4,871 | $57,670 | $8,500 | $49,170 |
| 2022 | $4,248 | $50,590 | $8,500 | $42,090 |
| 2021 | $4,049 | $49,410 | $8,500 | $40,910 |
| 2020 | $4,055 | $48,470 | $8,500 | $39,970 |
| 2019 | $4,025 | $48,470 | $8,500 | $39,970 |
| 2018 | $3,845 | $48,200 | $10,760 | $37,440 |
| 2017 | $3,761 | $48,200 | $10,760 | $37,440 |
| 2016 | $3,594 | $45,910 | $10,250 | $35,660 |
| 2015 | $3,505 | $44,150 | $9,860 | $34,290 |
| 2014 | $3,505 | $42,080 | $9,760 | $32,320 |
| 2013 | $3,118 | $43,710 | $9,760 | $33,950 |
Source: Public Records
Map
Nearby Homes
- 400 Massey Ln
- 12 Newland Ln
- 510 S Westgate Ave
- 1903 Mound Rd
- 414 S Westgate Ave
- 1835 Mound Rd
- 2 Valleyview Rd
- 1815 Mound Rd
- 1924 Cedar St
- 207 Mound Place
- 1 Jones Place
- 1856 Plum St
- 3 Ivywood Dr
- 307 Westwinds Dr
- 8 Westfair Dr
- 1401 Hoagland Blvd
- 121 City Place
- 310 Woodland Place
- 33 Windrush Dr
- 290 Finley St