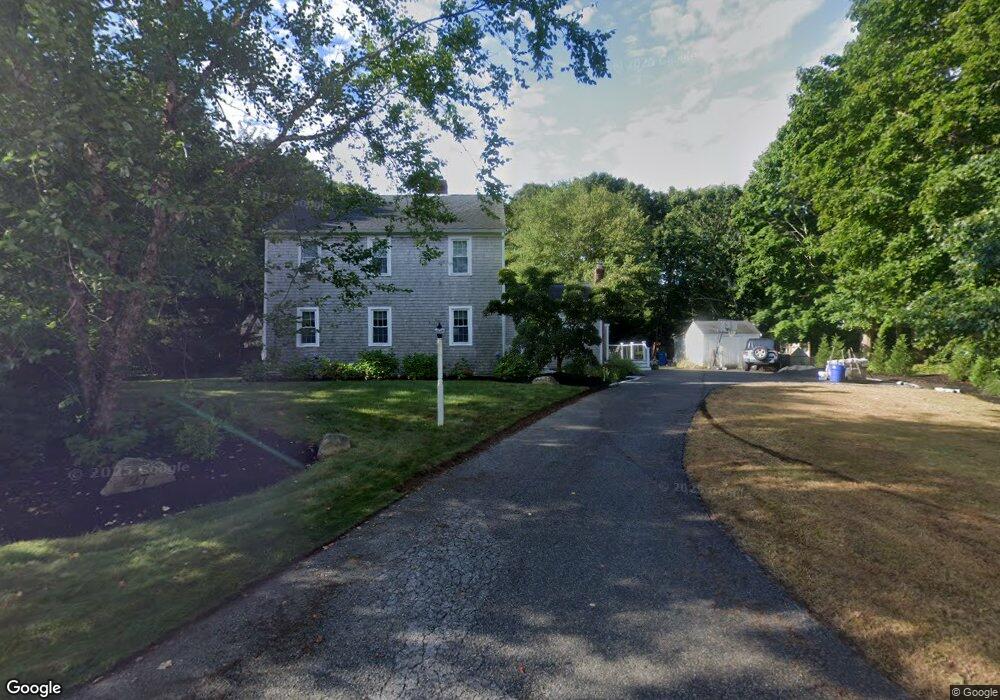
27 Perry Rd North Falmouth, MA 02556
North Falmouth NeighborhoodEstimated Value: $756,000 - $947,000
3
Beds
2
Baths
2,074
Sq Ft
$400/Sq Ft
Est. Value
About This Home
This home is located at 27 Perry Rd, North Falmouth, MA 02556 and is currently estimated at $829,261, approximately $399 per square foot. 27 Perry Rd is a home located in Barnstable County with nearby schools including North Falmouth Elementary School, Morse Pond School, and Lawrence School.
Ownership History
Date
Name
Owned For
Owner Type
Purchase Details
Closed on
Jun 30, 2009
Sold by
Sabens Gary E and Sabens Margaret E
Bought by
Swain Aaron Coleman and Swain Devon Wescott
Current Estimated Value
Home Financials for this Owner
Home Financials are based on the most recent Mortgage that was taken out on this home.
Original Mortgage
$318,750
Outstanding Balance
$202,151
Interest Rate
4.92%
Mortgage Type
Purchase Money Mortgage
Estimated Equity
$627,110
Create a Home Valuation Report for This Property
The Home Valuation Report is an in-depth analysis detailing your home's value as well as a comparison with similar homes in the area
Home Values in the Area
Average Home Value in this Area
Purchase History
| Date | Buyer | Sale Price | Title Company |
|---|---|---|---|
| Swain Aaron Coleman | $375,000 | -- | |
| Swain Aaron Coleman | $375,000 | -- |
Source: Public Records
Mortgage History
| Date | Status | Borrower | Loan Amount |
|---|---|---|---|
| Open | Swain Aaron Coleman | $318,750 | |
| Closed | Swain Aaron Coleman | $318,750 | |
| Previous Owner | Swain Aaron Coleman | $271,300 |
Source: Public Records
Tax History Compared to Growth
Tax History
| Year | Tax Paid | Tax Assessment Tax Assessment Total Assessment is a certain percentage of the fair market value that is determined by local assessors to be the total taxable value of land and additions on the property. | Land | Improvement |
|---|---|---|---|---|
| 2025 | $3,957 | $674,100 | $271,300 | $402,800 |
| 2024 | $3,794 | $604,200 | $237,400 | $366,800 |
| 2023 | $3,403 | $491,800 | $186,500 | $305,300 |
| 2022 | $3,369 | $418,500 | $164,400 | $254,100 |
| 2021 | $3,147 | $370,200 | $150,700 | $219,500 |
| 2020 | $3,062 | $356,500 | $137,000 | $219,500 |
| 2019 | $2,891 | $337,700 | $137,000 | $200,700 |
| 2018 | $2,853 | $331,700 | $137,000 | $194,700 |
| 2017 | $2,774 | $325,200 | $137,000 | $188,200 |
| 2016 | $2,722 | $325,200 | $137,000 | $188,200 |
| 2015 | $2,663 | $325,200 | $137,000 | $188,200 |
| 2014 | $2,698 | $331,100 | $144,100 | $187,000 |
Source: Public Records
Map
Nearby Homes