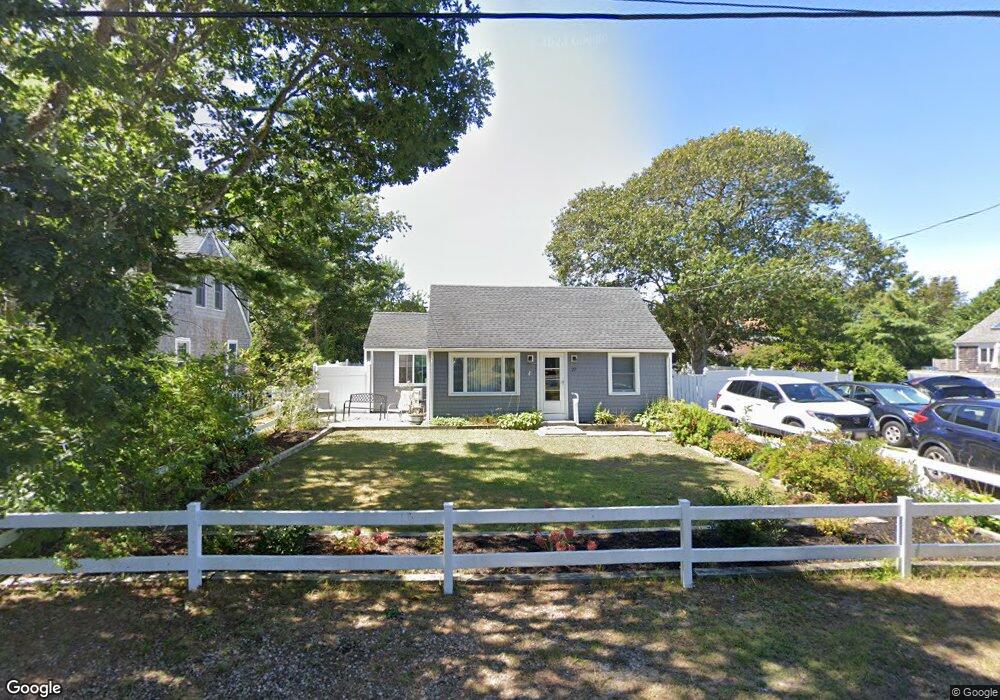
27 Pine St Dennis Port, MA 02639
Dennis Port NeighborhoodEstimated Value: $474,000 - $595,165
2
Beds
1
Bath
598
Sq Ft
$906/Sq Ft
Est. Value
About This Home
This home is located at 27 Pine St, Dennis Port, MA 02639 and is currently estimated at $542,041, approximately $906 per square foot. 27 Pine St is a home located in Barnstable County with nearby schools including Dennis-Yarmouth Regional High School and St. Pius X. School.
Ownership History
Date
Name
Owned For
Owner Type
Purchase Details
Closed on
Nov 15, 2007
Sold by
Bernner Elizabeth F
Bought by
Kennedy Virginia L
Current Estimated Value
Home Financials for this Owner
Home Financials are based on the most recent Mortgage that was taken out on this home.
Original Mortgage
$180,000
Outstanding Balance
$114,064
Interest Rate
6.41%
Mortgage Type
Purchase Money Mortgage
Estimated Equity
$427,977
Create a Home Valuation Report for This Property
The Home Valuation Report is an in-depth analysis detailing your home's value as well as a comparison with similar homes in the area
Home Values in the Area
Average Home Value in this Area
Purchase History
| Date | Buyer | Sale Price | Title Company |
|---|---|---|---|
| Kennedy Virginia L | $180,000 | -- |
Source: Public Records
Mortgage History
| Date | Status | Borrower | Loan Amount |
|---|---|---|---|
| Open | Kennedy Virginia L | $180,000 |
Source: Public Records
Tax History Compared to Growth
Tax History
| Year | Tax Paid | Tax Assessment Tax Assessment Total Assessment is a certain percentage of the fair market value that is determined by local assessors to be the total taxable value of land and additions on the property. | Land | Improvement |
|---|---|---|---|---|
| 2025 | $2,074 | $478,900 | $293,600 | $185,300 |
| 2024 | $1,931 | $439,800 | $282,300 | $157,500 |
| 2023 | $1,868 | $399,900 | $256,700 | $143,200 |
| 2022 | $1,737 | $310,200 | $202,300 | $107,900 |
| 2021 | $1,717 | $284,800 | $198,300 | $86,500 |
| 2020 | $1,688 | $276,800 | $198,300 | $78,500 |
| 2019 | $1,733 | $280,800 | $211,100 | $69,700 |
| 2018 | $1,677 | $264,500 | $201,100 | $63,400 |
| 2017 | $1,517 | $246,600 | $185,300 | $61,300 |
| 2016 | $1,476 | $226,100 | $174,700 | $51,400 |
| 2015 | $1,447 | $226,100 | $174,700 | $51,400 |
| 2014 | $1,368 | $215,500 | $164,100 | $51,400 |
Source: Public Records
Map
Nearby Homes
- 402 Old Wharf Rd
- 402 Old Wharf Rd
- 11 Ocean Park W
- 405 Old Wharf Rd Unit B204
- 405 Old Wharf Rd Unit B204
- 102 Sea St
- 9 Chase Ave Unit 6
- 22 Ferncliff Rd
- 26 Manning Rd
- 12 Cross St
- 1 E Belmont Unit 630
- 159 Center St Unit 22
- 37-A Beach Hills Rd
- 37 Beach Hills Rd
- 1 Belmont Rd Unit 630
- 1 Belmont Rd Unit 513
- 262 Old Wharf Rd Unit 67
- 262 Old Wharf Rd Unit 5
- 262 Old Wharf Rd Unit 5
- 262 Old Wharf Rd Unit 20