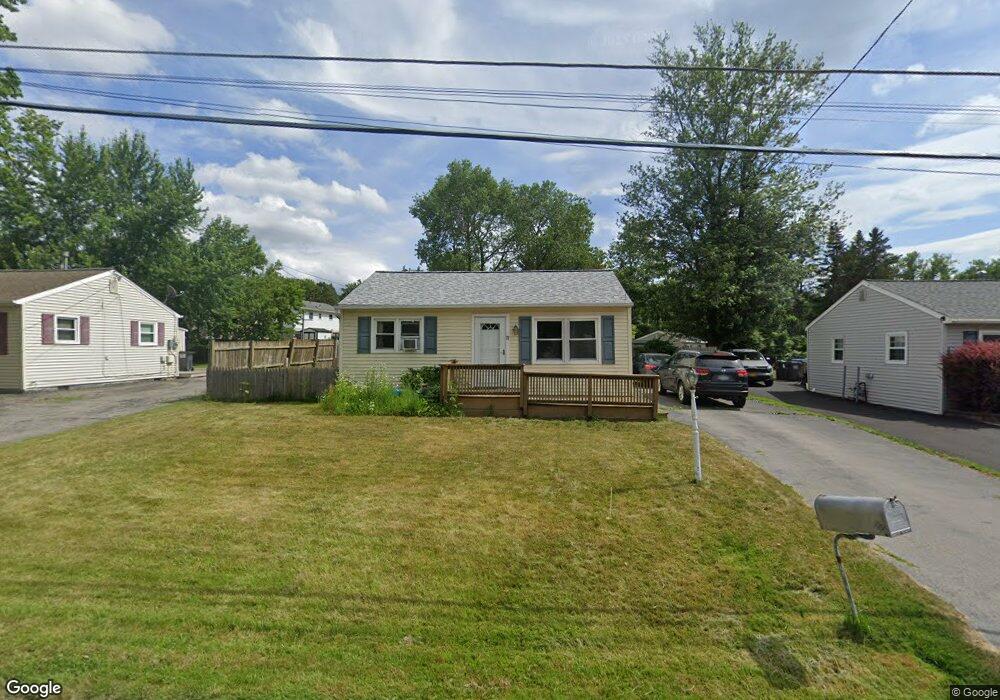
27 Plaske Dr Schenectady, NY 12309
Estimated Value: $246,079 - $291,000
2
Beds
1
Bath
1,037
Sq Ft
$257/Sq Ft
Est. Value
About This Home
This home is located at 27 Plaske Dr, Schenectady, NY 12309 and is currently estimated at $266,770, approximately $257 per square foot. 27 Plaske Dr is a home located in Albany County with nearby schools including Veeder Elementary School, Lisha Kill Middle School, and Colonie Central High School.
Ownership History
Date
Name
Owned For
Owner Type
Purchase Details
Closed on
May 8, 2008
Sold by
Pinckney Barbara
Bought by
Pinckney Dale
Current Estimated Value
Home Financials for this Owner
Home Financials are based on the most recent Mortgage that was taken out on this home.
Original Mortgage
$28,200
Outstanding Balance
$17,887
Interest Rate
5.91%
Estimated Equity
$248,883
Purchase Details
Closed on
Aug 16, 1996
Sold by
Roemer Michele M
Bought by
Pinckney Barbara A
Create a Home Valuation Report for This Property
The Home Valuation Report is an in-depth analysis detailing your home's value as well as a comparison with similar homes in the area
Home Values in the Area
Average Home Value in this Area
Purchase History
| Date | Buyer | Sale Price | Title Company |
|---|---|---|---|
| Pinckney Dale | -- | -- | |
| Pinckney Dale B | -- | None Available | |
| Pinckney Barbara A | $74,500 | -- |
Source: Public Records
Mortgage History
| Date | Status | Borrower | Loan Amount |
|---|---|---|---|
| Open | Pinckney Dale B | $28,200 |
Source: Public Records
Tax History
| Year | Tax Paid | Tax Assessment Tax Assessment Total Assessment is a certain percentage of the fair market value that is determined by local assessors to be the total taxable value of land and additions on the property. | Land | Improvement |
|---|---|---|---|---|
| 2024 | $3,565 | $74,500 | $14,900 | $59,600 |
| 2023 | $3,452 | $74,500 | $14,900 | $59,600 |
| 2022 | $3,374 | $74,500 | $14,900 | $59,600 |
| 2021 | $3,330 | $74,500 | $14,900 | $59,600 |
| 2020 | $2,738 | $74,500 | $14,900 | $59,600 |
| 2019 | $1,565 | $74,500 | $14,900 | $59,600 |
| 2018 | $2,635 | $74,500 | $14,900 | $59,600 |
| 2017 | $0 | $74,500 | $14,900 | $59,600 |
| 2016 | $2,579 | $74,500 | $14,900 | $59,600 |
| 2015 | -- | $74,500 | $14,900 | $59,600 |
| 2014 | -- | $74,500 | $14,900 | $59,600 |
Source: Public Records
Map
Nearby Homes
- 4 Kings Mill Ct
- 31 Amelia Dr
- 101 Waterman Ave
- 30 Priddle Ln
- 76 Tamarack Ln
- 4 Dahlem Blvd
- 73 Ashtree Ln
- 11 Gabby Ct
- 7 Theresa Ann Ct
- 647 Pearse Rd
- 20 Hampshire Way
- 4 Oaktree Ln
- 35 Cole Ave
- 331 Vly Rd
- 2115 Central Ave Unit 24
- 2115 Central Ave Unit 9
- 2115 Central Ave Unit 115
- 2965 Hillcrest Rd
- 2448 Westminster Way
- 871 Maxwell Dr
Your Personal Tour Guide
Ask me questions while you tour the home.