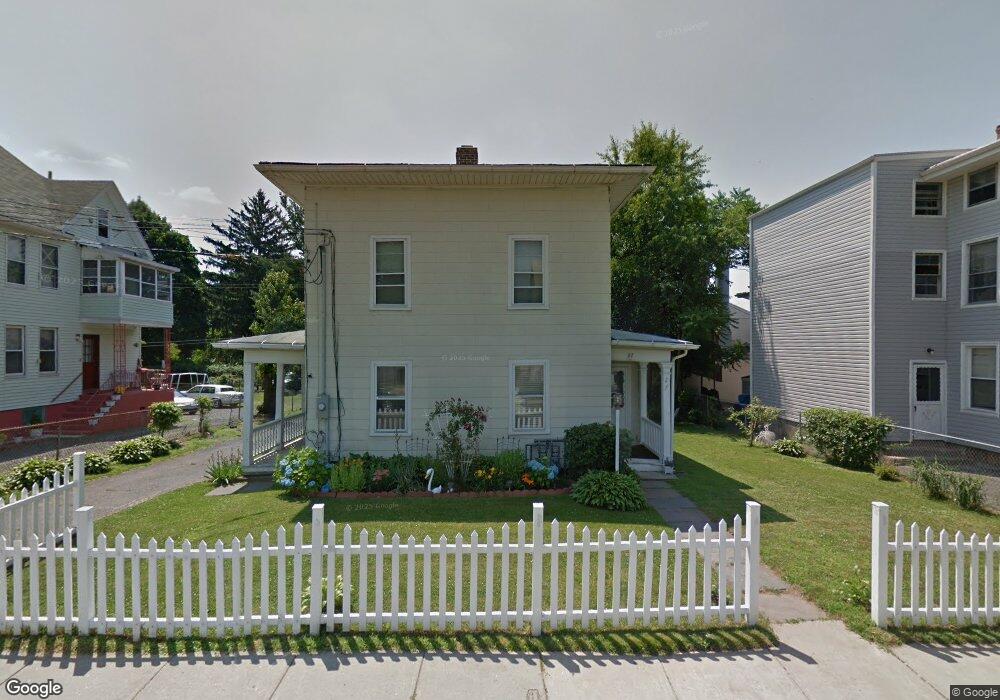
27 Pleasant St New Britain, CT 06051
Estimated Value: $272,901 - $319,000
5
Beds
2
Baths
1,704
Sq Ft
$169/Sq Ft
Est. Value
About This Home
This home is located at 27 Pleasant St, New Britain, CT 06051 and is currently estimated at $288,225, approximately $169 per square foot. 27 Pleasant St is a home located in Hartford County with nearby schools including Smith School, Slade Middle School, and Mountain Laurel Sudbury School.
Ownership History
Date
Name
Owned For
Owner Type
Purchase Details
Closed on
Oct 15, 2003
Sold by
Amos Nancy M
Bought by
Hendricks James and Hendricks Debra
Current Estimated Value
Home Financials for this Owner
Home Financials are based on the most recent Mortgage that was taken out on this home.
Original Mortgage
$110,500
Interest Rate
9.62%
Purchase Details
Closed on
Jun 15, 2001
Sold by
Est Bostrom Thurpe E and Holmberg Mabel
Bought by
Amos Nancy M
Home Financials for this Owner
Home Financials are based on the most recent Mortgage that was taken out on this home.
Original Mortgage
$58,100
Interest Rate
7.15%
Create a Home Valuation Report for This Property
The Home Valuation Report is an in-depth analysis detailing your home's value as well as a comparison with similar homes in the area
Home Values in the Area
Average Home Value in this Area
Purchase History
| Date | Buyer | Sale Price | Title Company |
|---|---|---|---|
| Hendricks James | $130,000 | -- | |
| Amos Nancy M | $59,900 | -- |
Source: Public Records
Mortgage History
| Date | Status | Borrower | Loan Amount |
|---|---|---|---|
| Open | Amos Nancy M | $127,500 | |
| Closed | Amos Nancy M | $110,500 | |
| Previous Owner | Amos Nancy M | $58,100 |
Source: Public Records
Tax History
| Year | Tax Paid | Tax Assessment Tax Assessment Total Assessment is a certain percentage of the fair market value that is determined by local assessors to be the total taxable value of land and additions on the property. | Land | Improvement |
|---|---|---|---|---|
| 2025 | $4,854 | $123,900 | $36,820 | $87,080 |
| 2024 | $4,905 | $123,900 | $36,820 | $87,080 |
| 2023 | $4,743 | $123,900 | $36,820 | $87,080 |
| 2022 | $3,891 | $78,610 | $16,940 | $61,670 |
| 2021 | $3,891 | $78,610 | $16,940 | $61,670 |
| 2020 | $3,970 | $78,610 | $16,940 | $61,670 |
| 2019 | $3,970 | $78,610 | $16,940 | $61,670 |
| 2018 | $3,970 | $78,610 | $16,940 | $61,670 |
| 2017 | $3,683 | $72,940 | $16,940 | $56,000 |
| 2016 | $3,683 | $72,940 | $16,940 | $56,000 |
| 2015 | $3,574 | $72,940 | $16,940 | $56,000 |
| 2014 | $3,574 | $72,940 | $16,940 | $56,000 |
Source: Public Records
Map
Nearby Homes
Your Personal Tour Guide
Ask me questions while you tour the home.