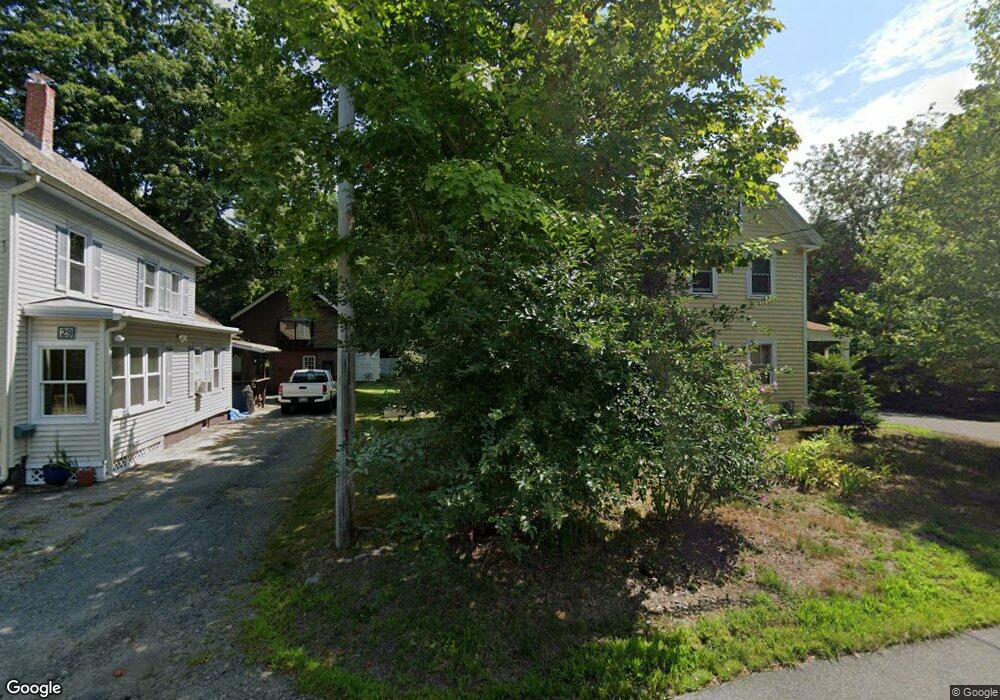
27 Pond St Georgetown, MA 01833
Estimated Value: $552,000 - $649,000
2
Beds
2
Baths
1,562
Sq Ft
$388/Sq Ft
Est. Value
About This Home
This home is located at 27 Pond St, Georgetown, MA 01833 and is currently estimated at $606,626, approximately $388 per square foot. 27 Pond St is a home located in Essex County with nearby schools including Perley Elementary School, Penn Brook School, and Georgetown High School.
Ownership History
Date
Name
Owned For
Owner Type
Purchase Details
Closed on
Jan 29, 2019
Sold by
Degiovanni Andrea and Degiovanni Joseph
Bought by
Degiovanni Joseph
Current Estimated Value
Home Financials for this Owner
Home Financials are based on the most recent Mortgage that was taken out on this home.
Original Mortgage
$260,000
Outstanding Balance
$227,188
Interest Rate
4.4%
Mortgage Type
New Conventional
Estimated Equity
$379,438
Purchase Details
Closed on
Oct 31, 2008
Sold by
Tasker Patricia A and Walsh Patricia A
Bought by
Degiovanni Joseph and Degiovanni Andrea
Purchase Details
Closed on
Jun 16, 1995
Sold by
Timmons Mary B Est and Timmons
Bought by
Tasker Patricia A and Walsh Timothy A
Create a Home Valuation Report for This Property
The Home Valuation Report is an in-depth analysis detailing your home's value as well as a comparison with similar homes in the area
Home Values in the Area
Average Home Value in this Area
Purchase History
| Date | Buyer | Sale Price | Title Company |
|---|---|---|---|
| Degiovanni Joseph | -- | -- | |
| Degiovanni Joseph | $275,000 | -- | |
| Tasker Patricia A | $124,000 | -- |
Source: Public Records
Mortgage History
| Date | Status | Borrower | Loan Amount |
|---|---|---|---|
| Open | Degiovanni Joseph | $260,000 | |
| Previous Owner | Tasker Patricia A | $241,700 | |
| Previous Owner | Tasker Patricia A | $240,000 | |
| Previous Owner | Tasker Patricia A | $205,700 |
Source: Public Records
Tax History
| Year | Tax Paid | Tax Assessment Tax Assessment Total Assessment is a certain percentage of the fair market value that is determined by local assessors to be the total taxable value of land and additions on the property. | Land | Improvement |
|---|---|---|---|---|
| 2025 | $6,086 | $550,300 | $259,200 | $291,100 |
| 2024 | $5,177 | $412,500 | $178,800 | $233,700 |
| 2023 | $5,036 | $388,000 | $178,800 | $209,200 |
| 2022 | $5,134 | $364,600 | $155,400 | $209,200 |
| 2021 | $4,807 | $302,500 | $155,400 | $147,100 |
| 2020 | $4,816 | $302,500 | $155,400 | $147,100 |
| 2019 | $4,625 | $293,100 | $152,400 | $140,700 |
| 2018 | $4,654 | $293,100 | $152,400 | $140,700 |
| 2017 | $4,668 | $288,000 | $152,400 | $135,600 |
| 2016 | $4,329 | $272,800 | $152,400 | $120,400 |
| 2015 | $4,301 | $268,300 | $152,400 | $115,900 |
| 2014 | $3,770 | $268,300 | $152,400 | $115,900 |
Source: Public Records
Map
Nearby Homes
- 32 Summer St
- 11 Central St
- 8 Molloy Rd
- 206 W Main St Unit 5
- 206 W Main St Unit 4
- 206 W Main St Unit 2
- 206 W Main St Unit 3
- 231 W Main St
- 10 Ashcroft Cir
- 98 West St
- 107 King George Dr Unit 9
- 1 Atwood Ln
- 901 Alyssa Dr
- 12 Warren St
- 11 Main St
- 13 Main St
- 66 Parish Rd Unit 8
- 870 Haverhill St Unit 2B
- 38 Main St
- 53 Woodcrest Rd
Your Personal Tour Guide
Ask me questions while you tour the home.