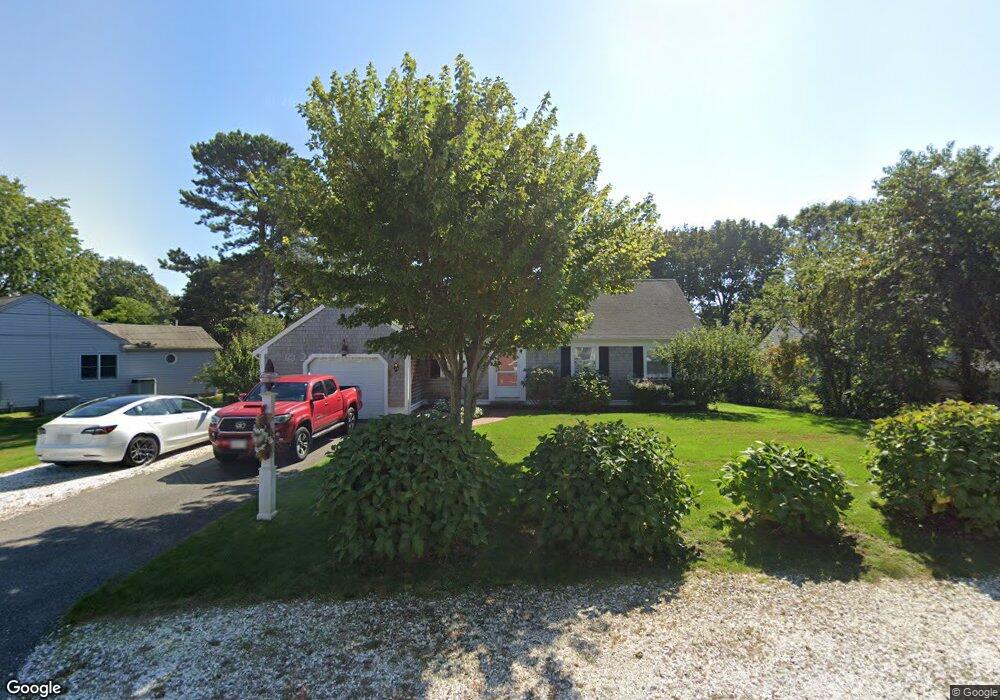
27 Porter Ln West Dennis, MA 02670
West Dennis NeighborhoodEstimated Value: $1,133,000 - $1,224,000
3
Beds
2
Baths
1,407
Sq Ft
$833/Sq Ft
Est. Value
About This Home
This home is located at 27 Porter Ln, West Dennis, MA 02670 and is currently estimated at $1,171,868, approximately $832 per square foot. 27 Porter Ln is a home located in Barnstable County with nearby schools including Dennis-Yarmouth Regional High School and St. Pius X. School.
Ownership History
Date
Name
Owned For
Owner Type
Purchase Details
Closed on
Oct 28, 2011
Sold by
Brady Peter and Brady Marie T
Bought by
Warren Mark F and Warren Susan J
Current Estimated Value
Home Financials for this Owner
Home Financials are based on the most recent Mortgage that was taken out on this home.
Original Mortgage
$417,000
Interest Rate
4.11%
Mortgage Type
Purchase Money Mortgage
Purchase Details
Closed on
Jun 28, 2004
Sold by
Foley Danae A and Foley John E
Bought by
Brady Marie T and Brady Peter
Purchase Details
Closed on
Nov 26, 1997
Sold by
Whitehead David R and Whitehead Anne F
Bought by
Foley John E
Create a Home Valuation Report for This Property
The Home Valuation Report is an in-depth analysis detailing your home's value as well as a comparison with similar homes in the area
Home Values in the Area
Average Home Value in this Area
Purchase History
| Date | Buyer | Sale Price | Title Company |
|---|---|---|---|
| Warren Mark F | $543,000 | -- | |
| Brady Marie T | $730,000 | -- | |
| Foley John E | $183,500 | -- |
Source: Public Records
Mortgage History
| Date | Status | Borrower | Loan Amount |
|---|---|---|---|
| Open | Foley John E | $330,000 | |
| Closed | Warren Mark F | $417,000 | |
| Previous Owner | Foley John E | $74,000 | |
| Previous Owner | Foley John E | $252,700 | |
| Previous Owner | Foley John E | $152,000 |
Source: Public Records
Tax History Compared to Growth
Tax History
| Year | Tax Paid | Tax Assessment Tax Assessment Total Assessment is a certain percentage of the fair market value that is determined by local assessors to be the total taxable value of land and additions on the property. | Land | Improvement |
|---|---|---|---|---|
| 2025 | $4,727 | $1,091,600 | $548,900 | $542,700 |
| 2024 | $4,535 | $1,033,000 | $527,900 | $505,100 |
| 2023 | $4,386 | $939,200 | $479,900 | $459,300 |
| 2022 | $4,070 | $726,800 | $389,100 | $337,700 |
| 2021 | $8,112 | $687,300 | $381,400 | $305,900 |
| 2020 | $3,911 | $641,100 | $363,300 | $277,800 |
| 2019 | $3,744 | $606,800 | $356,200 | $250,600 |
| 2018 | $3,595 | $567,100 | $339,100 | $228,000 |
| 2017 | $3,421 | $556,300 | $339,100 | $217,200 |
| 2016 | $3,536 | $541,500 | $356,000 | $185,500 |
| 2015 | $3,466 | $541,500 | $356,000 | $185,500 |
| 2014 | $3,259 | $513,300 | $327,800 | $185,500 |
Source: Public Records
Map
Nearby Homes
- 2 Rita Mary Way
- 181 Pleasant St
- 308 Old Main St
- 14 Schoolhouse Ln
- 745 Willow St
- 209 Main St Unit 3
- 209 Main St Unit 6
- 209 Main St Unit 1
- 209 Main St Unit 2
- 209 Main St Unit 4
- 209 Main St Unit 5
- 40 Kelley Rd
- 45 Seth Ln
- 22 Powhatan Rd
- 178 School St
- 23 Doric Ave
- 17 South St
- 15 Sharon Rd
- 29 Bass River Rd
- 9 Victory Ln