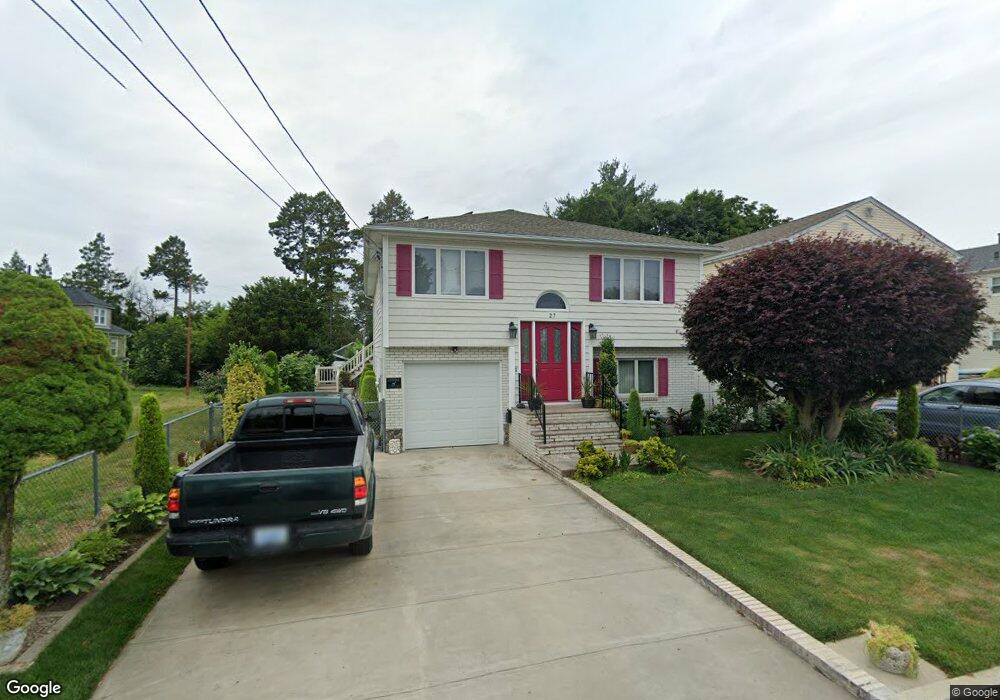
27 Public St East Providence, RI 02914
Outer East Bay NeighborhoodEstimated Value: $439,000 - $524,000
3
Beds
2
Baths
1,812
Sq Ft
$259/Sq Ft
Est. Value
About This Home
This home is located at 27 Public St, East Providence, RI 02914 and is currently estimated at $469,551, approximately $259 per square foot. 27 Public St is a home located in Providence County with nearby schools including East Providence High School, Ocean State Montessori School, and The Gordon School.
Ownership History
Date
Name
Owned For
Owner Type
Purchase Details
Closed on
Mar 12, 1991
Sold by
Decastro Antonio
Bought by
Maciel Gabriel G
Current Estimated Value
Home Financials for this Owner
Home Financials are based on the most recent Mortgage that was taken out on this home.
Original Mortgage
$93,000
Interest Rate
9.51%
Mortgage Type
Purchase Money Mortgage
Create a Home Valuation Report for This Property
The Home Valuation Report is an in-depth analysis detailing your home's value as well as a comparison with similar homes in the area
Home Values in the Area
Average Home Value in this Area
Purchase History
| Date | Buyer | Sale Price | Title Company |
|---|---|---|---|
| Maciel Gabriel G | $130,000 | -- | |
| Maciel Gabriel G | $130,000 | -- |
Source: Public Records
Mortgage History
| Date | Status | Borrower | Loan Amount |
|---|---|---|---|
| Closed | Maciel Gabriel G | $93,000 |
Source: Public Records
Tax History Compared to Growth
Tax History
| Year | Tax Paid | Tax Assessment Tax Assessment Total Assessment is a certain percentage of the fair market value that is determined by local assessors to be the total taxable value of land and additions on the property. | Land | Improvement |
|---|---|---|---|---|
| 2025 | $5,470 | $418,500 | $85,500 | $333,000 |
| 2024 | $5,681 | $370,600 | $71,300 | $299,300 |
| 2023 | $5,470 | $370,600 | $71,300 | $299,300 |
| 2022 | $5,159 | $236,000 | $38,800 | $197,200 |
| 2021 | $5,074 | $236,000 | $37,400 | $198,600 |
| 2020 | $4,859 | $236,000 | $37,400 | $198,600 |
| 2019 | $4,725 | $236,000 | $37,400 | $198,600 |
| 2018 | $4,864 | $212,600 | $39,300 | $173,300 |
| 2017 | $4,756 | $212,600 | $39,300 | $173,300 |
| 2016 | $4,732 | $212,600 | $39,300 | $173,300 |
| 2015 | $4,668 | $203,400 | $48,500 | $154,900 |
| 2014 | $4,668 | $203,400 | $48,500 | $154,900 |
Source: Public Records
Map
Nearby Homes
- 400 Juniper St Unit C
- 400 Juniper St Unit B
- 400 Juniper St Unit A
- 78 Ingraham St
- 322 Mauran Ave
- 195 Lyon Ave Unit 197
- 109 Bliss St
- 108 Bliss St
- 15 S Carpenter St
- 4 S Carpenter St
- 74 Brookhaven Dr
- 320 Mauran Ave
- 152 Freeborn Ave
- 1402 S Broadway
- 17 Brown St Unit 19
- 18 Baker St Unit 20
- 82 Martin St
- 164 Brightridge Ave
- 93 Warren Ave
- 89 Warren Ave
- 23 Public St Unit 25
- 17 Mason St
- 30 Public St Unit 32
- 19 Public St Unit 21
- 25 Mason St
- 11 Mason St
- 15 Public St Unit 17
- 17 Public St
- 37 Public St
- 20 Mason St
- 20 Fleming St
- 27 Mason St
- 29 Fleming St
- 21 Fleming St
- 25 Fleming St Unit 27
- 30 Mason St
- 1109 S Broadway
- 17 Fleming St
- 407 Juniper St
- 1129 S Broadway