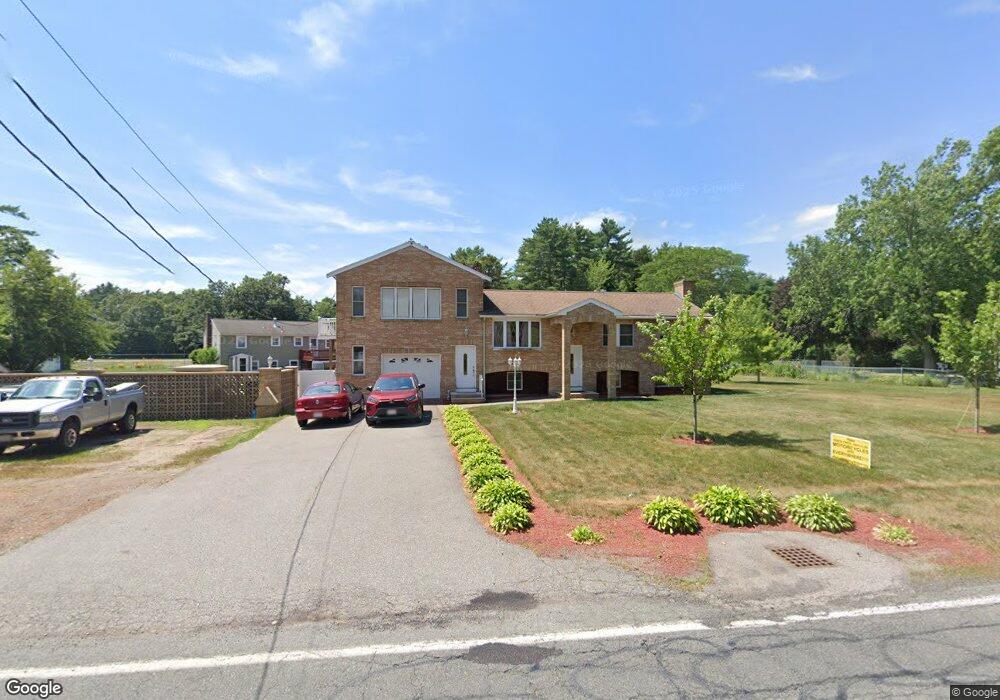
27 Purchase St Carver, MA 02330
Estimated Value: $616,000 - $681,000
4
Beds
3
Baths
1,929
Sq Ft
$339/Sq Ft
Est. Value
About This Home
This home is located at 27 Purchase St, Carver, MA 02330 and is currently estimated at $654,666, approximately $339 per square foot. 27 Purchase St is a home located in Plymouth County with nearby schools including Carver Elementary School, Carver Middle/High School, and Samuel Fuller School.
Ownership History
Date
Name
Owned For
Owner Type
Purchase Details
Closed on
May 1, 2003
Sold by
Izzo Elizabeth I and Izzo Michael P
Bought by
Izzo John J
Current Estimated Value
Home Financials for this Owner
Home Financials are based on the most recent Mortgage that was taken out on this home.
Original Mortgage
$152,000
Interest Rate
5.82%
Mortgage Type
Purchase Money Mortgage
Create a Home Valuation Report for This Property
The Home Valuation Report is an in-depth analysis detailing your home's value as well as a comparison with similar homes in the area
Home Values in the Area
Average Home Value in this Area
Purchase History
| Date | Buyer | Sale Price | Title Company |
|---|---|---|---|
| Izzo John J | $190,000 | -- |
Source: Public Records
Mortgage History
| Date | Status | Borrower | Loan Amount |
|---|---|---|---|
| Open | Izzo John J | $174,000 | |
| Closed | Izzo John J | $175,000 | |
| Closed | Izzo John J | $152,000 | |
| Previous Owner | Izzo John J | $47,378 |
Source: Public Records
Tax History
| Year | Tax Paid | Tax Assessment Tax Assessment Total Assessment is a certain percentage of the fair market value that is determined by local assessors to be the total taxable value of land and additions on the property. | Land | Improvement |
|---|---|---|---|---|
| 2025 | $7,760 | $559,500 | $131,400 | $428,100 |
| 2024 | $7,643 | $539,400 | $128,800 | $410,600 |
| 2023 | $7,336 | $502,800 | $128,800 | $374,000 |
| 2022 | $7,017 | $439,100 | $110,100 | $329,000 |
| 2021 | $6,725 | $397,000 | $98,300 | $298,700 |
| 2020 | $6,486 | $377,300 | $91,900 | $285,400 |
| 2019 | $6,266 | $367,500 | $89,200 | $278,300 |
| 2018 | $6,081 | $344,900 | $89,200 | $255,700 |
| 2017 | $5,832 | $329,700 | $85,800 | $243,900 |
| 2016 | $5,240 | $307,700 | $81,700 | $226,000 |
| 2015 | $5,089 | $299,200 | $81,700 | $217,500 |
| 2014 | $4,926 | $289,600 | $103,400 | $186,200 |
Source: Public Records
Map
Nearby Homes
- 35 Silva St
- 67 Crystal Lake Dr
- 40 Fosdick Rd
- 7 Cedar Dr
- 11 Brockton Ave
- 26 Santana Way Unit 26
- 89 Silva St
- 81 Center St
- 70 Wall St
- 235 Main St
- Lot1 Elk Run Dr
- 11 Opal Ave
- 43 S Meadow Rd
- 6 Susan Cir
- 114 Meadow St
- 13 Pond View Way
- 56 Bunnys Rd
- 48 S Meadow Village
- 29 S Meadow Village
- 55 S Meadow Village
Your Personal Tour Guide
Ask me questions while you tour the home.