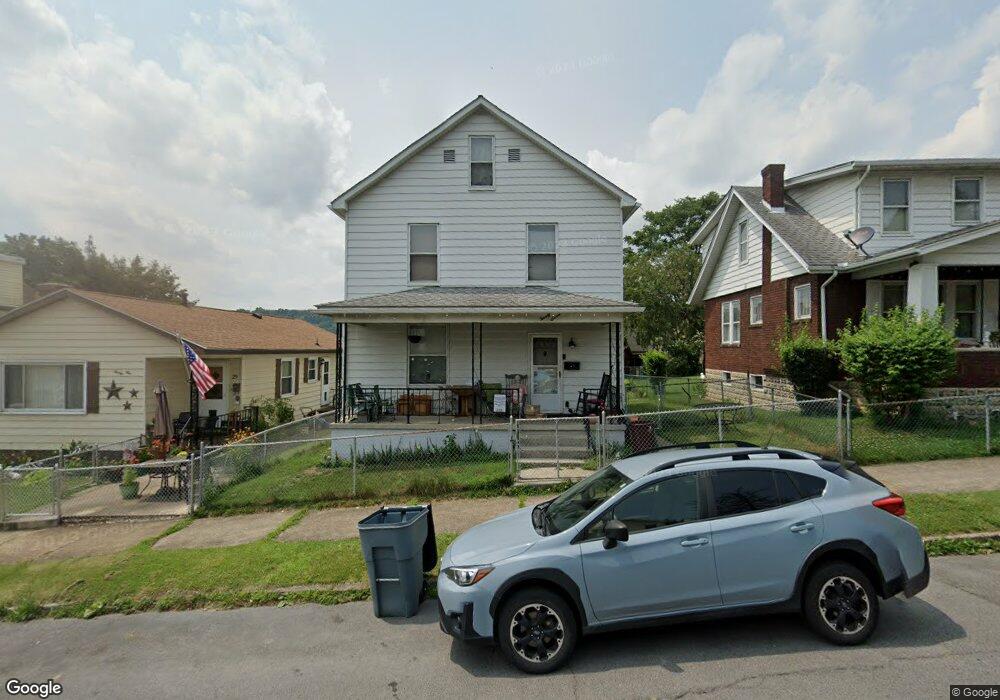
27 Race St Cumberland, MD 21502
Estimated Value: $81,811 - $109,000
--
Bed
1
Bath
1,344
Sq Ft
$70/Sq Ft
Est. Value
About This Home
This home is located at 27 Race St, Cumberland, MD 21502 and is currently estimated at $94,703, approximately $70 per square foot. 27 Race St is a home located in Allegany County with nearby schools including South Penn Elementary School, Washington Middle School, and Fort Hill High School.
Ownership History
Date
Name
Owned For
Owner Type
Purchase Details
Closed on
Nov 25, 2024
Sold by
Stump Brittany A and Stump Bryan K
Bought by
Stump Brittany A
Current Estimated Value
Purchase Details
Closed on
Oct 24, 2014
Sold by
Yonker Carol L and Riley Terrence W
Bought by
Stump Brittany A and Stump Bryan K
Purchase Details
Closed on
Oct 10, 2002
Sold by
Kastner Francis T
Bought by
Riley Terrence W and Yonker Carol L
Create a Home Valuation Report for This Property
The Home Valuation Report is an in-depth analysis detailing your home's value as well as a comparison with similar homes in the area
Home Values in the Area
Average Home Value in this Area
Purchase History
| Date | Buyer | Sale Price | Title Company |
|---|---|---|---|
| Stump Brittany A | -- | None Listed On Document | |
| Stump Brittany A | -- | None Listed On Document | |
| Stump Brittany A | -- | None Available | |
| Riley Terrence W | $43,500 | -- |
Source: Public Records
Mortgage History
| Date | Status | Borrower | Loan Amount |
|---|---|---|---|
| Closed | Riley Terrence W | -- |
Source: Public Records
Tax History Compared to Growth
Tax History
| Year | Tax Paid | Tax Assessment Tax Assessment Total Assessment is a certain percentage of the fair market value that is determined by local assessors to be the total taxable value of land and additions on the property. | Land | Improvement |
|---|---|---|---|---|
| 2025 | $573 | $62,533 | $0 | $0 |
| 2024 | $549 | $58,567 | $0 | $0 |
| 2023 | $508 | $54,600 | $8,000 | $46,600 |
| 2022 | $503 | $54,167 | $0 | $0 |
| 2021 | $503 | $53,733 | $0 | $0 |
| 2020 | $495 | $53,300 | $7,000 | $46,300 |
| 2019 | $488 | $52,267 | $0 | $0 |
| 2018 | $487 | $51,233 | $0 | $0 |
| 2017 | $474 | $50,200 | $0 | $0 |
| 2016 | $0 | $50,200 | $0 | $0 |
| 2015 | -- | $50,200 | $0 | $0 |
| 2014 | -- | $50,200 | $0 | $0 |
Source: Public Records
Map
Nearby Homes