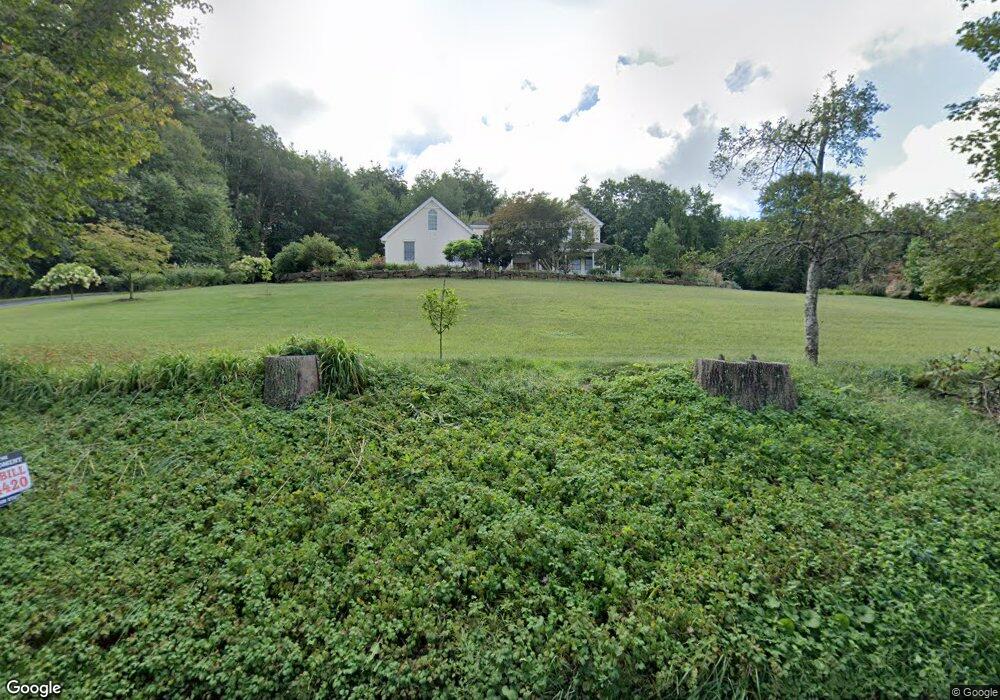
27 Red Bridge Rd Wilbraham, MA 01095
Estimated Value: $539,000 - $648,000
3
Beds
3
Baths
2,436
Sq Ft
$238/Sq Ft
Est. Value
About This Home
This home is located at 27 Red Bridge Rd, Wilbraham, MA 01095 and is currently estimated at $579,965, approximately $238 per square foot. 27 Red Bridge Rd is a home located in Hampden County with nearby schools including Minnechaug Regional High School and St John The Baptist School.
Ownership History
Date
Name
Owned For
Owner Type
Purchase Details
Closed on
Nov 7, 2003
Sold by
Cheria Helen and Johnson Helen
Bought by
Johnson Helen and Johnson Herbert I
Current Estimated Value
Home Financials for this Owner
Home Financials are based on the most recent Mortgage that was taken out on this home.
Original Mortgage
$192,000
Outstanding Balance
$89,074
Interest Rate
6.01%
Mortgage Type
Purchase Money Mortgage
Estimated Equity
$490,891
Create a Home Valuation Report for This Property
The Home Valuation Report is an in-depth analysis detailing your home's value as well as a comparison with similar homes in the area
Home Values in the Area
Average Home Value in this Area
Purchase History
| Date | Buyer | Sale Price | Title Company |
|---|---|---|---|
| Johnson Helen | -- | -- |
Source: Public Records
Mortgage History
| Date | Status | Borrower | Loan Amount |
|---|---|---|---|
| Open | Johnson Helen | $192,000 |
Source: Public Records
Tax History
| Year | Tax Paid | Tax Assessment Tax Assessment Total Assessment is a certain percentage of the fair market value that is determined by local assessors to be the total taxable value of land and additions on the property. | Land | Improvement |
|---|---|---|---|---|
| 2025 | $9,403 | $525,900 | $99,000 | $426,900 |
| 2024 | $9,337 | $504,700 | $99,000 | $405,700 |
| 2023 | $8,348 | $452,100 | $99,000 | $353,100 |
| 2022 | $8,348 | $407,400 | $99,000 | $308,400 |
| 2021 | $8,481 | $369,400 | $102,600 | $266,800 |
| 2020 | $8,267 | $369,400 | $102,600 | $266,800 |
| 2019 | $8,053 | $369,400 | $102,600 | $266,800 |
| 2018 | $8,006 | $353,600 | $102,600 | $251,000 |
| 2017 | $7,779 | $353,600 | $102,600 | $251,000 |
| 2016 | $7,655 | $354,400 | $113,100 | $241,300 |
| 2015 | $7,400 | $354,400 | $113,100 | $241,300 |
Source: Public Records
Map
Nearby Homes
- 30 Red Bridge Rd Land Lot 3
- 30 Red Bridge Rd Land Lot 1
- 30 Red Bridge Rd Land Lot 6
- 30 Red Bridge Rd Land Lot 8
- 30 Red Bridge Rd Land Lot 4
- 30 Red Bridge Rd Land Lot 5
- 30 Red Bridge Rd Land Lot 7
- 10 Alden St
- 406 Springfield St
- Lot 88 Turning Leaf Equinox Pass
- 38 King Dr
- 44 Balsam Hill Rd
- 37 Balsam Hill Rd
- 1172 East St
- 80 Elizabeth Dr
- 429 Moore St
- Lot B Woodland Cir
- Lot 28 Tower Rd
- 517 S Washington St
- 5 Silver St
- 171 Chilson Rd
- 29 Red Bridge Rd
- 24 Red Bridge Rd
- 155 Chilson Rd
- 28 Red Bridge Rd
- 22 Red Bridge Rd
- 31 Red Bridge Rd
- 33 Red Bridge Rd
- 150 Chilson Rd
- 20 Red Bridge Rd
- 135 Chilson Rd
- 26 Red Bridge Rd
- 120 Chilson Rd
- 18 Red Bridge Rd
- 110 Chilson Rd
- 110 Chilson Rd
- 110 Chilson Rd Unit 110
- 110 Chilson Rd
- 115 Chilson Rd
- 19 Red Bridge Rd
Your Personal Tour Guide
Ask me questions while you tour the home.