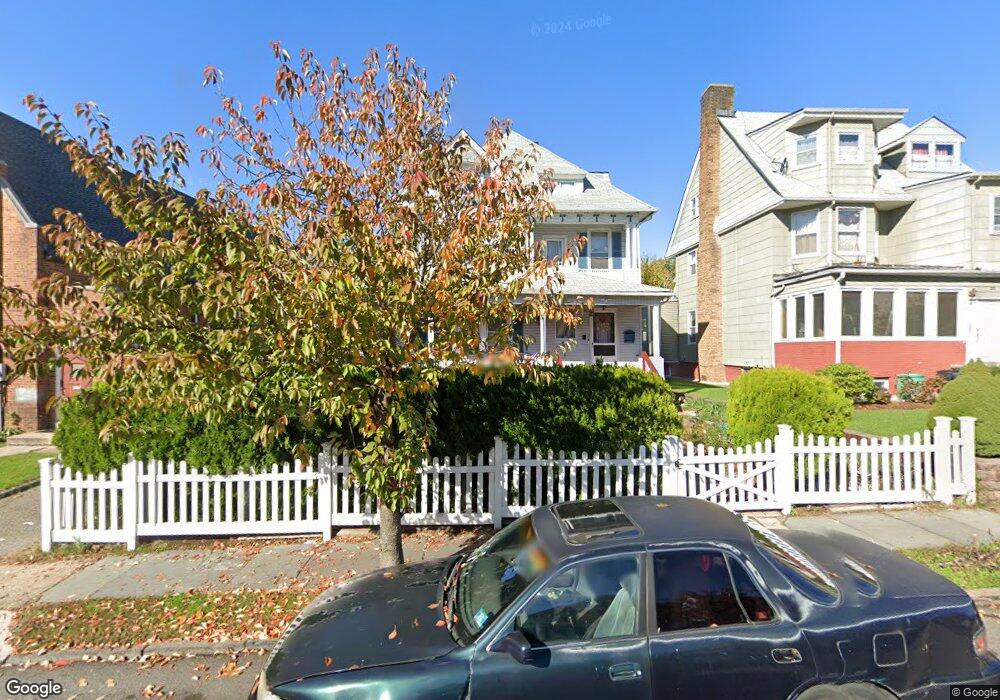
27 Ridge St Orange, NJ 07050
Estimated Value: $2,310,000
--
Bed
--
Bath
2,643
Sq Ft
$874/Sq Ft
Est. Value
About This Home
This home is located at 27 Ridge St, Orange, NJ 07050 and is currently estimated at $2,310,000, approximately $874 per square foot. 27 Ridge St is a home located in Essex County with nearby schools including East Orange Community Charter School.
Ownership History
Date
Name
Owned For
Owner Type
Purchase Details
Closed on
May 2, 2023
Sold by
Va 475 Urban Renewal Llc
Bought by
Va 475 Urban Renewal Llc
Current Estimated Value
Purchase Details
Closed on
Jun 8, 2022
Sold by
Fouche Dominique and Fouche Marie L
Bought by
Va 27 R Llc
Purchase Details
Closed on
Oct 30, 1998
Sold by
Molina Osscar A
Bought by
Fouche Dominque and Fouche Marie L
Home Financials for this Owner
Home Financials are based on the most recent Mortgage that was taken out on this home.
Original Mortgage
$118,750
Interest Rate
6.84%
Create a Home Valuation Report for This Property
The Home Valuation Report is an in-depth analysis detailing your home's value as well as a comparison with similar homes in the area
Home Values in the Area
Average Home Value in this Area
Purchase History
| Date | Buyer | Sale Price | Title Company |
|---|---|---|---|
| Va 475 Urban Renewal Llc | -- | None Listed On Document | |
| Va 475 Urban Renewal Llc | -- | None Listed On Document | |
| Va 27 R Llc | $600,000 | Madison Title | |
| Fouche Dominque | $125,000 | -- |
Source: Public Records
Mortgage History
| Date | Status | Borrower | Loan Amount |
|---|---|---|---|
| Previous Owner | Fouche Dominque | $118,750 |
Source: Public Records
Tax History Compared to Growth
Tax History
| Year | Tax Paid | Tax Assessment Tax Assessment Total Assessment is a certain percentage of the fair market value that is determined by local assessors to be the total taxable value of land and additions on the property. | Land | Improvement |
|---|---|---|---|---|
| 2025 | $14,550 | $1,512,000 | $1,512,000 | -- |
| 2024 | $14,550 | $2,520,000 | $2,520,000 | $0 |
| 2022 | $13,531 | $390,400 | $107,500 | $282,900 |
| 2021 | $13,323 | $230,500 | $87,100 | $143,400 |
| 2020 | $12,924 | $230,500 | $87,100 | $143,400 |
| 2019 | $12,251 | $230,500 | $87,100 | $143,400 |
| 2018 | $12,055 | $230,500 | $87,100 | $143,400 |
| 2017 | $11,225 | $230,500 | $87,100 | $143,400 |
| 2016 | $11,013 | $230,500 | $87,100 | $143,400 |
| 2015 | $10,725 | $230,500 | $87,100 | $143,400 |
| 2014 | $10,255 | $230,500 | $87,100 | $143,400 |
Source: Public Records
Map
Nearby Homes