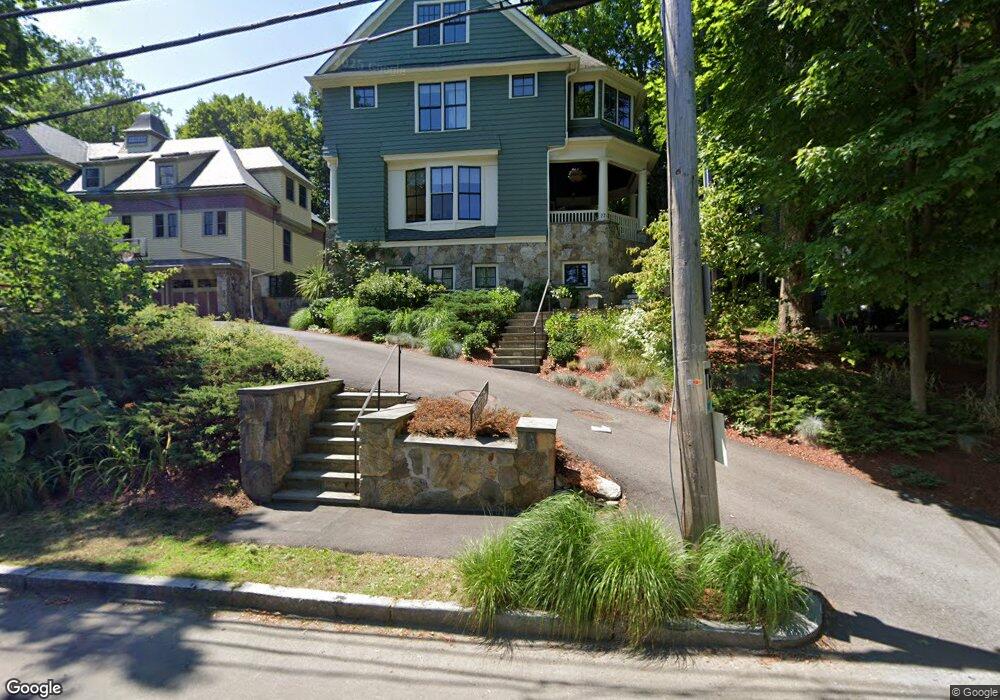
27 Ripley St Newton, MA 02459
Newton Centre NeighborhoodEstimated Value: $2,527,000 - $2,953,000
5
Beds
5
Baths
4,323
Sq Ft
$638/Sq Ft
Est. Value
About This Home
This home is located at 27 Ripley St, Newton, MA 02459 and is currently estimated at $2,756,745, approximately $637 per square foot. 27 Ripley St is a home located in Middlesex County with nearby schools including Bowen School, Oak Hill Middle School, and Newton South High School.
Ownership History
Date
Name
Owned For
Owner Type
Purchase Details
Closed on
Sep 28, 2007
Sold by
Moresi-Cunningham J M and Michael Cunningham P
Bought by
Warnke Peter C
Current Estimated Value
Home Financials for this Owner
Home Financials are based on the most recent Mortgage that was taken out on this home.
Original Mortgage
$1,100,000
Outstanding Balance
$702,464
Interest Rate
6.65%
Mortgage Type
Purchase Money Mortgage
Estimated Equity
$2,054,281
Purchase Details
Closed on
Jun 1, 2006
Sold by
Emily Investments Llc
Bought by
Cunningham J Margaret M and Michael Cunningham P
Home Financials for this Owner
Home Financials are based on the most recent Mortgage that was taken out on this home.
Original Mortgage
$1,180,000
Interest Rate
6.55%
Mortgage Type
Purchase Money Mortgage
Create a Home Valuation Report for This Property
The Home Valuation Report is an in-depth analysis detailing your home's value as well as a comparison with similar homes in the area
Home Values in the Area
Average Home Value in this Area
Purchase History
| Date | Buyer | Sale Price | Title Company |
|---|---|---|---|
| Warnke Peter C | $1,550,000 | -- | |
| Cunningham J Margaret M | $1,475,000 | -- |
Source: Public Records
Mortgage History
| Date | Status | Borrower | Loan Amount |
|---|---|---|---|
| Open | Warnke Peter C | $1,100,000 | |
| Previous Owner | Cunningham J Margaret M | $1,180,000 |
Source: Public Records
Tax History Compared to Growth
Tax History
| Year | Tax Paid | Tax Assessment Tax Assessment Total Assessment is a certain percentage of the fair market value that is determined by local assessors to be the total taxable value of land and additions on the property. | Land | Improvement |
|---|---|---|---|---|
| 2025 | $25,541 | $2,606,200 | $1,037,400 | $1,568,800 |
| 2024 | $24,696 | $2,530,300 | $1,007,200 | $1,523,100 |
| 2023 | $23,948 | $2,352,500 | $774,100 | $1,578,400 |
| 2022 | $22,915 | $2,178,200 | $716,800 | $1,461,400 |
| 2021 | $22,111 | $2,054,900 | $676,200 | $1,378,700 |
| 2020 | $21,545 | $2,063,700 | $676,200 | $1,387,500 |
| 2019 | $20,938 | $2,003,600 | $656,500 | $1,347,100 |
| 2018 | $20,219 | $1,868,700 | $591,800 | $1,276,900 |
| 2017 | $19,603 | $1,762,900 | $558,300 | $1,204,600 |
| 2016 | $18,750 | $1,647,600 | $521,800 | $1,125,800 |
| 2015 | $17,877 | $1,539,800 | $487,700 | $1,052,100 |
Source: Public Records
Map
Nearby Homes
- 9 Ripley St Unit 1
- 154 Langley Rd Unit 1
- 145 Warren St Unit 4
- 20 Bartlett Terrace
- 42 Bow Rd
- 20 Hamlet St
- 20 Hamlet St Unit 1
- 5 Halcyon Rd
- 42 Sunhill Ln
- 60 Chapin Rd
- 44 Irving St
- 628 Boylston St
- 671 Boylston St
- 21 Francis St Unit 21A
- 1004 Centre St
- 23 Francis St Unit 23-1
- 250 Hammond Pond Pkwy Unit 1604N
- 250 Hammond Pond Pkwy Unit 1002N
- 250 Hammond Pond Pkwy Unit 614S
- 250 Hammond Pond Pkwy Unit 615N
- 27 Ripley C-12 St
- 27 Ripley C-12 St Unit 2
- 27 Ripley C-12 St Unit 27
- 19 Ripley St Unit 21
- 31 Ripley St
- 31 Ripley St
- 108 Herrick Rd
- 35 Ripley St Unit 37
- 35 Ripley St Unit 2
- 24 Ripley St
- 114 Herrick Rd
- 102 Herrick Rd
- 9 Ripley St
- 9 Ripley St
- 30 Ripley St Unit 2
- 30 Ripley St
- 18 Ripley St
- 18 Ripley St
- 34 Ripley St Unit 36
- 20 Ripley St