27 Robin Rd Lynnfield, MA 01940
Estimated Value: $1,183,000 - $1,459,000
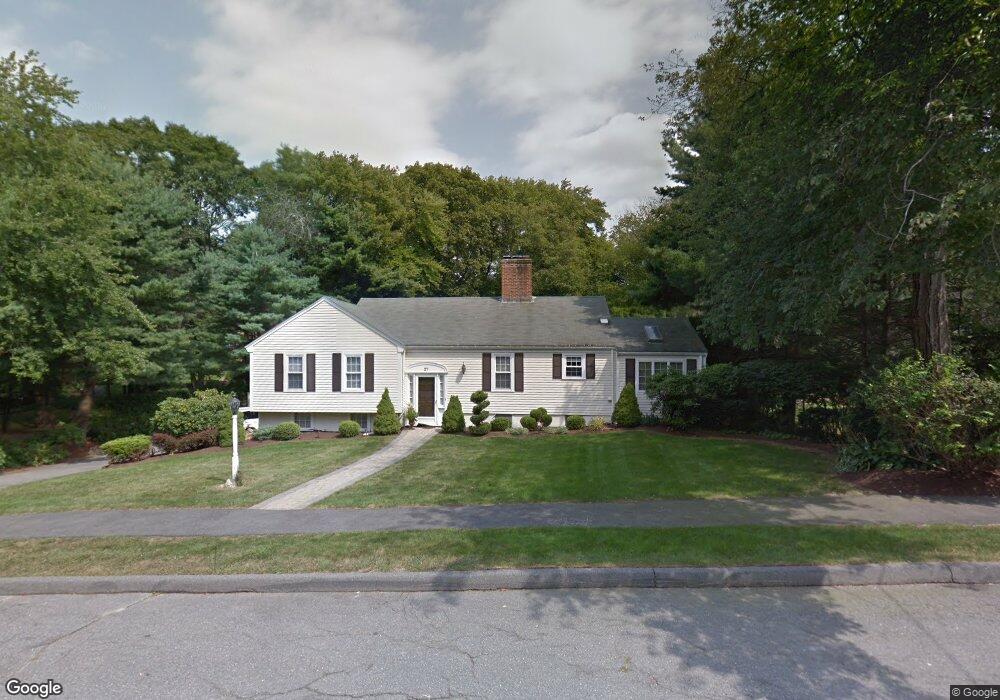
About This Home
This home is located at 27 Robin Rd, Lynnfield, MA 01940 and is currently estimated at $1,314,420, approximately $558 per square foot. 27 Robin Rd is a home located in Essex County with nearby schools including Lynnfield Middle School, Lynnfield High School, and Our Lady Of Assumption School.
Ownership History
We collect this data history from publicly available records. To have your information removed, we recommend requesting removal directly through your county’s website.
Purchase Details
Home Financials for this Owner
Home Financials are based on the most recent Mortgage that was taken out on this home.Purchase Details
Home Values in the Area
Average Home Value in this Area
Purchase History
We collect this data history from publicly available records. To have your information removed, we recommend requesting removal directly through your county’s website.
| Date | Buyer | Sale Price | Title Company |
|---|---|---|---|
| $610,000 | -- | ||
| $610,000 | -- | ||
| $375,000 | -- | ||
| $375,000 | -- |
Mortgage History
We collect this data history from publicly available records. To have your information removed, we recommend requesting removal directly through your county’s website.
| Date | Status | Borrower | Loan Amount |
|---|---|---|---|
| Open | $417,000 | ||
| Closed | $417,000 | ||
| Previous Owner | $25,000 |
Tax History
We collect this data history from publicly available records. To have your information removed, we recommend requesting removal directly through your county’s website.
| Year | Tax Paid | Tax Assessment Tax Assessment Total Assessment is a certain percentage of the fair market value that is determined by local assessors to be the total taxable value of land and additions on the property. | Land | Improvement |
|---|---|---|---|---|
| 2025 | $14,239 | $1,348,400 | $564,500 | $783,900 |
| 2024 | $13,681 | $1,301,700 | $542,800 | $758,900 |
| 2023 | $13,447 | $1,190,000 | $514,800 | $675,200 |
| 2022 | $12,628 | $1,053,200 | $472,800 | $580,400 |
| 2021 | $12,450 | $938,200 | $385,300 | $552,900 |
| 2020 | $12,502 | $898,100 | $345,100 | $553,000 |
| 2019 | $12,437 | $894,100 | $345,100 | $549,000 |
| 2018 | $8,782 | $638,200 | $345,100 | $293,100 |
| 2017 | $8,625 | $625,900 | $332,800 | $293,100 |
| 2016 | $8,126 | $560,400 | $285,600 | $274,800 |
| 2015 | $8,104 | $559,300 | $284,500 | $274,800 |
Map
- 7 Longbow Cir
- 3 Stafford Rd
- 39 Doncaster Cir
- 29 Trickett Rd
- 18 Williams Rd
- 420 Salem St
- 67 Brook Dr
- 6 Suntaug St
- 741 Salem St
- 37 Maple St
- 3 Driftwood Ln
- 628 Broadway - Aka Ward Terrace
- 527 Salem St Unit 3
- 344 Salem St
- 1 Westway
- 344 Broadway
- 2 Carpenter Rd
- 4203 Woodbridge Rd Unit 4203
- 4904 Heatherwood Ln
- 71 Bourque Rd
Ask me questions while you tour the home.