Estimated Value: $265,000 - $288,000
3
Beds
2
Baths
956
Sq Ft
$294/Sq Ft
Est. Value
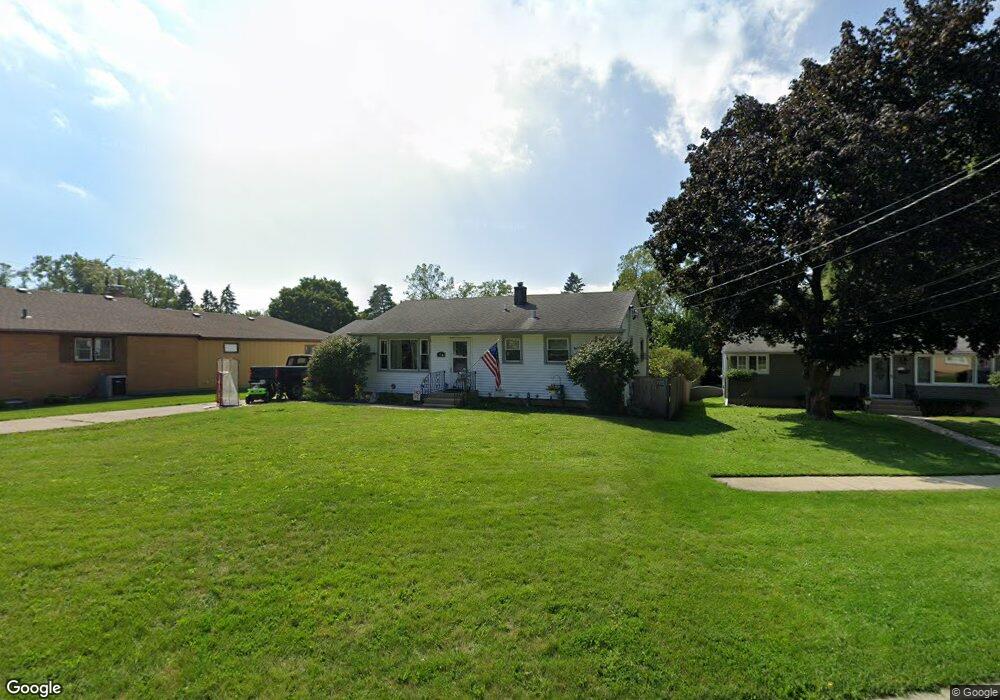
About This Home
This home is located at 27 Ross Ave, Cary, IL 60013 and is currently estimated at $280,958, approximately $293 per square foot. 27 Ross Ave is a home located in McHenry County with nearby schools including Three Oaks Elementary School, Cary Jr High School, and Cary-Grove High School.
Ownership History
Date
Name
Owned For
Owner Type
Purchase Details
Closed on
Apr 6, 2012
Sold by
Bell David and Bell Kathleen
Bought by
Kalios Lucas M and Kalios Erin J
Current Estimated Value
Home Financials for this Owner
Home Financials are based on the most recent Mortgage that was taken out on this home.
Original Mortgage
$117,932
Outstanding Balance
$80,839
Interest Rate
3.75%
Mortgage Type
FHA
Estimated Equity
$200,119
Purchase Details
Closed on
Mar 31, 2012
Sold by
Bell Nick
Bought by
Kalios Lucas M and Kalios Erin J
Home Financials for this Owner
Home Financials are based on the most recent Mortgage that was taken out on this home.
Original Mortgage
$117,932
Outstanding Balance
$80,839
Interest Rate
3.75%
Mortgage Type
FHA
Estimated Equity
$200,119
Purchase Details
Closed on
Nov 28, 2006
Sold by
Psota Laddie F
Bought by
Laddie F Psota Trust
Purchase Details
Closed on
Aug 2, 1995
Sold by
Psota Laddie F and Psota Eleanore F
Bought by
Psota Laddie F and Psota Eleanore F
Create a Home Valuation Report for This Property
The Home Valuation Report is an in-depth analysis detailing your home's value as well as a comparison with similar homes in the area
Home Values in the Area
Average Home Value in this Area
Purchase History
| Date | Buyer | Sale Price | Title Company |
|---|---|---|---|
| Kalios Lucas M | $121,000 | Ort | |
| Kalios Lucas M | -- | Old Republic National Title | |
| Kalios Lucas M | -- | Old Republic National Title | |
| Laddie F Psota Trust | -- | None Available | |
| Psota Laddie F | -- | -- |
Source: Public Records
Mortgage History
| Date | Status | Borrower | Loan Amount |
|---|---|---|---|
| Open | Kalios Lucas M | $117,932 |
Source: Public Records
Tax History
| Year | Tax Paid | Tax Assessment Tax Assessment Total Assessment is a certain percentage of the fair market value that is determined by local assessors to be the total taxable value of land and additions on the property. | Land | Improvement |
|---|---|---|---|---|
| 2024 | $5,425 | $72,421 | $18,781 | $53,640 |
| 2023 | $5,255 | $64,771 | $16,797 | $47,974 |
| 2022 | $4,375 | $52,721 | $15,387 | $37,334 |
| 2021 | $4,149 | $49,116 | $14,335 | $34,781 |
| 2020 | $4,015 | $47,378 | $13,828 | $33,550 |
| 2019 | $3,922 | $45,346 | $13,235 | $32,111 |
| 2018 | $3,672 | $41,890 | $12,226 | $29,664 |
| 2017 | $3,581 | $39,463 | $11,518 | $27,945 |
| 2016 | $3,531 | $37,013 | $10,803 | $26,210 |
| 2013 | -- | $38,849 | $10,077 | $28,772 |
Source: Public Records
Map
Nearby Homes
- 128 E Main St
- 124 E Main St
- 112 Pearl St
- 321 Cold Spring St
- 341 Cold Spring St
- 331 Cold Spring St
- 371 Cold Spring St
- 47 Sunset Dr
- Lots 2,3,4 Northwest Hwy
- 103 S Seebert St Unit 1
- 330 Park Ave
- 349 Park Ave
- 2016 Grove Ln
- 440 W James Way
- 392 W Margaret Terrace
- 680 Spruce Tree Dr
- 1107 Spring Beach Way
- 204 Country Commons Rd
- LOT 02 Three Oaks Rd
- 1104 Hillcrest Ave
Your Personal Tour Guide
Ask me questions while you tour the home.