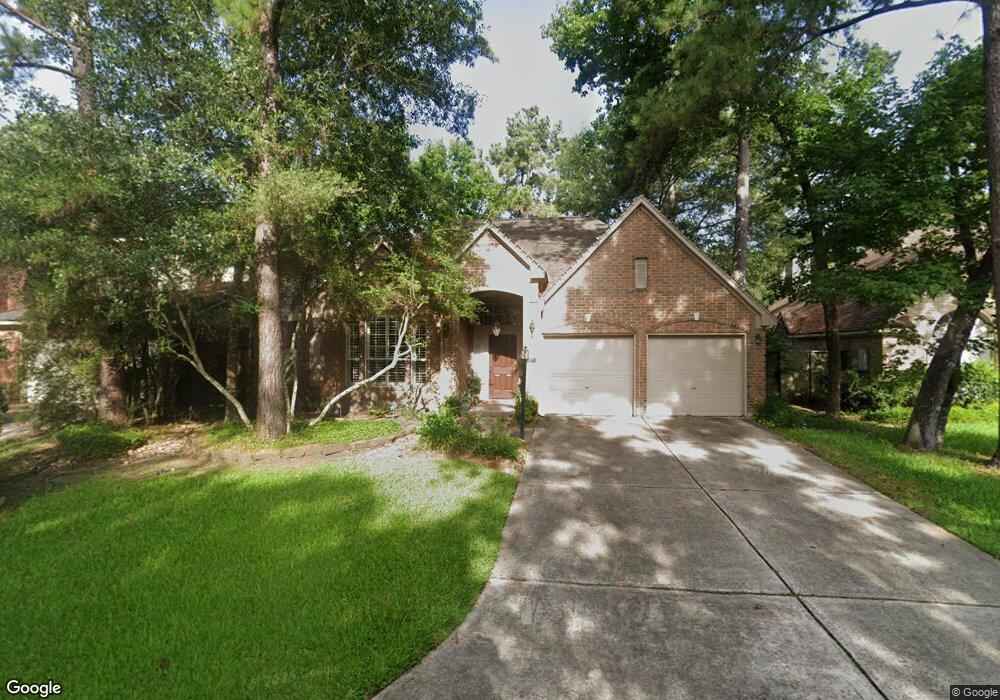
27 Roundtop Place Spring, TX 77381
Cochran's Crossing NeighborhoodEstimated Value: $420,808 - $510,000
3
Beds
2
Baths
2,145
Sq Ft
$221/Sq Ft
Est. Value
About This Home
This home is located at 27 Roundtop Place, Spring, TX 77381 and is currently estimated at $473,702, approximately $220 per square foot. 27 Roundtop Place is a home located in Montgomery County with nearby schools including David Elementary School, Collins Intermediate School, and Knox J High School.
Ownership History
Date
Name
Owned For
Owner Type
Purchase Details
Closed on
Dec 12, 2013
Sold by
Jordan Martha L
Bought by
Frederick Arthur C
Current Estimated Value
Home Financials for this Owner
Home Financials are based on the most recent Mortgage that was taken out on this home.
Original Mortgage
$189,200
Outstanding Balance
$141,023
Interest Rate
4.14%
Mortgage Type
New Conventional
Estimated Equity
$332,679
Purchase Details
Closed on
Sep 30, 1994
Sold by
Horton Katherine B
Bought by
Jordan Martha L
Home Financials for this Owner
Home Financials are based on the most recent Mortgage that was taken out on this home.
Original Mortgage
$70,000
Interest Rate
8.45%
Purchase Details
Closed on
Aug 14, 1990
Sold by
Weekley Homes Lp
Bought by
Frederick Arthur C and Julie Crawford
Purchase Details
Closed on
Mar 5, 1990
Sold by
Woodlands Land Dev Lp
Bought by
Frederick Arthur C and Julie Crawford
Create a Home Valuation Report for This Property
The Home Valuation Report is an in-depth analysis detailing your home's value as well as a comparison with similar homes in the area
Home Values in the Area
Average Home Value in this Area
Purchase History
| Date | Buyer | Sale Price | Title Company |
|---|---|---|---|
| Frederick Arthur C | -- | Alamo Title Company | |
| Jordan Martha L | -- | -- | |
| Frederick Arthur C | -- | -- | |
| Frederick Arthur C | -- | -- |
Source: Public Records
Mortgage History
| Date | Status | Borrower | Loan Amount |
|---|---|---|---|
| Open | Frederick Arthur C | $189,200 | |
| Previous Owner | Jordan Martha L | $70,000 |
Source: Public Records
Tax History
| Year | Tax Paid | Tax Assessment Tax Assessment Total Assessment is a certain percentage of the fair market value that is determined by local assessors to be the total taxable value of land and additions on the property. | Land | Improvement |
|---|---|---|---|---|
| 2025 | $4,952 | $363,409 | $60,000 | $303,409 |
| 2024 | $4,444 | $349,041 | -- | -- |
| 2023 | $4,444 | $317,310 | $60,000 | $312,380 |
| 2022 | $5,847 | $288,460 | $60,000 | $283,980 |
| 2021 | $5,720 | $262,240 | $13,670 | $248,570 |
| 2020 | $6,041 | $261,170 | $13,670 | $247,500 |
| 2019 | $6,162 | $258,200 | $13,670 | $244,530 |
| 2018 | $5,150 | $245,250 | $13,670 | $231,580 |
| 2017 | $5,925 | $245,250 | $13,670 | $231,580 |
| 2016 | $6,328 | $261,910 | $13,670 | $266,340 |
| 2015 | $5,067 | $238,100 | $13,670 | $246,060 |
| 2014 | $5,067 | $216,450 | $13,670 | $202,780 |
Source: Public Records
Map
Nearby Homes
- 100 W Rainbow Ridge Cir
- 80 Fallenstone Dr
- 39 Whistlers Walk Place
- 122 E Mistybreeze Cir
- 10 White Fawn Dr
- 170 Golden Shadow Cir
- 3 Still Corner Place
- 31 N Pathfinders Cir
- 5 Hidden Pond Place
- 18 Maize Meadow Place
- 10 Dovewood Place
- 12 Lakeridge Dr
- 22 Cricket Hollow Place
- 67 Winter Wheat Place
- 23 Eagle Rock Place
- 203 S Pathfinders Cir
- 95 N Pathfinders Cir
- 76 S Piper Trace
- 74 E Lakeridge Dr
- 66 Lakeridge Ct
- 31 Roundtop Place
- 23 Roundtop Place
- 23 Poplar Hill Place
- 19 Poplar Hill Place
- 35 Roundtop Place
- 19 Roundtop Place
- 15 Poplar Hill Place
- 27 Poplar Hill Place
- 15 Roundtop Place
- 11 Poplar Hill Place
- 56 Prides Crossing Dr
- 52 Prides Crossing Dr
- 26 Roundtop Place
- 22 Roundtop Place
- 30 Roundtop Place
- 11 Roundtop Place
- 48 Prides Crossing Dr
- 7 Poplar Hill Place
- 30 Poplar Hill Place
- 44 Prides Crossing Dr
Your Personal Tour Guide
Ask me questions while you tour the home.