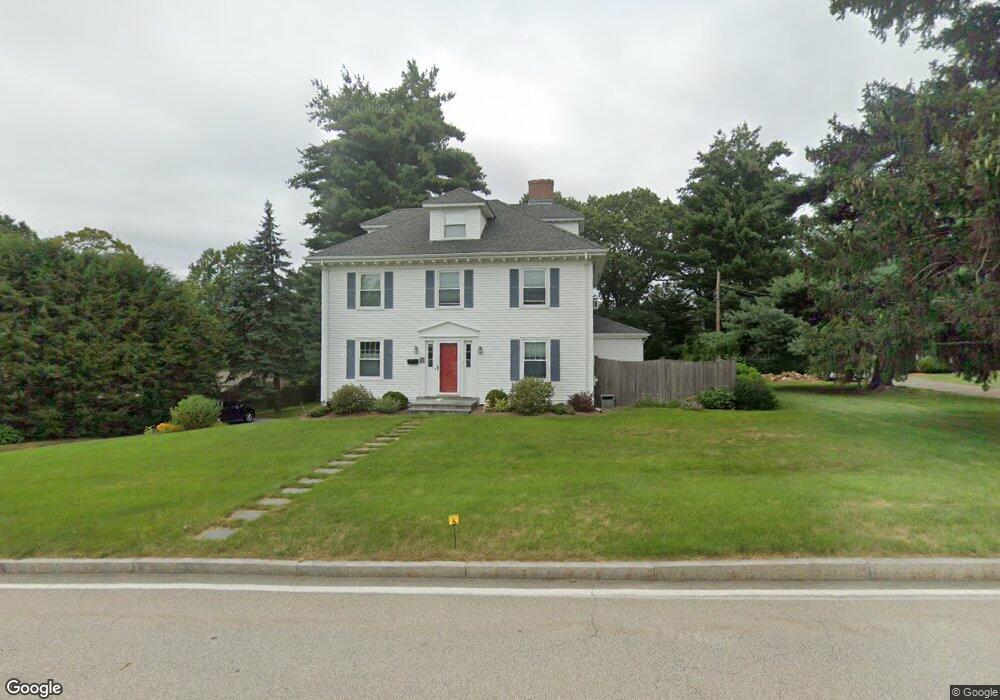
27 Rutledge Rd Natick, MA 01760
Estimated Value: $1,185,352 - $1,320,000
4
Beds
2
Baths
3,213
Sq Ft
$392/Sq Ft
Est. Value
About This Home
This home is located at 27 Rutledge Rd, Natick, MA 01760 and is currently estimated at $1,260,838, approximately $392 per square foot. 27 Rutledge Rd is a home located in Middlesex County with nearby schools including Natick High School, Wilson Middle School, and Bennett-Hemenway (Ben-Hem) Elementary School.
Ownership History
Date
Name
Owned For
Owner Type
Purchase Details
Closed on
Sep 5, 2025
Sold by
Lenson Evan P and Lenson Adrea
Bought by
Evan Paul Lenson T and Evan Lenson
Current Estimated Value
Purchase Details
Closed on
Apr 21, 2009
Sold by
Rutledge Road Nt and Craig
Bought by
Lenson Evan Paul and Lenson Adrea
Purchase Details
Closed on
Jul 2, 2003
Sold by
Miller Helen and Craig Karen
Bought by
Rutledge Road Nt and Trs
Create a Home Valuation Report for This Property
The Home Valuation Report is an in-depth analysis detailing your home's value as well as a comparison with similar homes in the area
Home Values in the Area
Average Home Value in this Area
Purchase History
| Date | Buyer | Sale Price | Title Company |
|---|---|---|---|
| Evan Paul Lenson T | -- | -- | |
| Lenson Evan Paul | $560,000 | -- | |
| Lenson Evan Paul | $560,000 | -- | |
| Rutledge Road Nt | -- | -- | |
| Rutledge Road Nt | -- | -- | |
| Miller Helen | -- | -- |
Source: Public Records
Mortgage History
| Date | Status | Borrower | Loan Amount |
|---|---|---|---|
| Previous Owner | Rutledge Road Nt | $60,000 |
Source: Public Records
Tax History
| Year | Tax Paid | Tax Assessment Tax Assessment Total Assessment is a certain percentage of the fair market value that is determined by local assessors to be the total taxable value of land and additions on the property. | Land | Improvement |
|---|---|---|---|---|
| 2025 | $12,099 | $1,011,600 | $480,200 | $531,400 |
| 2024 | $11,632 | $948,800 | $453,600 | $495,200 |
| 2023 | $11,204 | $886,400 | $424,100 | $462,300 |
| 2022 | $10,760 | $806,600 | $384,600 | $422,000 |
| 2021 | $10,331 | $759,100 | $363,500 | $395,600 |
| 2020 | $10,116 | $743,300 | $347,700 | $395,600 |
| 2019 | $9,447 | $743,300 | $347,700 | $395,600 |
| 2018 | $9,213 | $706,000 | $316,100 | $389,900 |
| 2017 | $9,009 | $667,800 | $285,100 | $382,700 |
| 2016 | $8,810 | $649,200 | $270,100 | $379,100 |
| 2015 | $8,537 | $617,700 | $270,100 | $347,600 |
Source: Public Records
Map
Nearby Homes
- 50 Wethersfield Rd
- 278 N Main St
- 293 Bacon St Unit A
- 5 Bradford Rd
- 7 Jackson Ct Unit B
- 4 Richard Rd
- 1 Richard Rd
- 25 Irving Rd
- 29 Irving Rd
- 27 2nd St
- 8 Liberty St
- 340 N Main St
- 136 Commonwealth Rd
- 5 Griffin Cir
- 36 Winnemay St
- 23 Lake St
- 37 Longfellow Rd
- 13 Shawmut Avenue Extension
- 40 Nouvelle Way Unit 441
- 9 Bellevue Rd
Your Personal Tour Guide
Ask me questions while you tour the home.