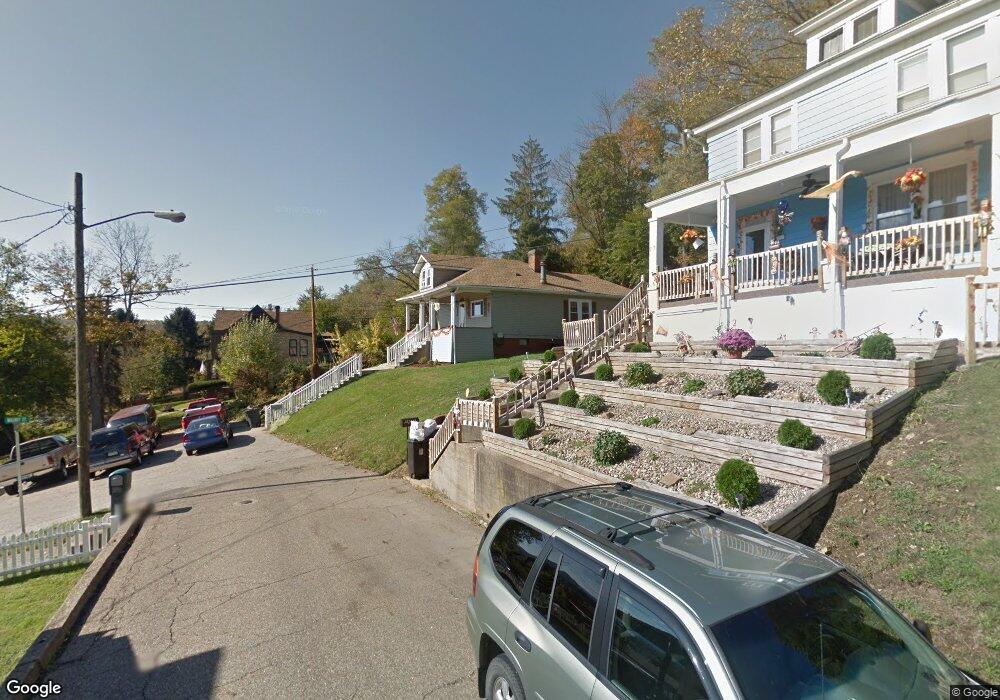
27 S 12th St Martins Ferry, OH 43935
Estimated Value: $62,000 - $85,444
2
Beds
1
Bath
1,000
Sq Ft
$71/Sq Ft
Est. Value
About This Home
This home is located at 27 S 12th St, Martins Ferry, OH 43935 and is currently estimated at $70,861, approximately $70 per square foot. 27 S 12th St is a home located in Belmont County with nearby schools including Anna Marie Ayers Elementary School, Martins Ferry Middle School, and Martins Ferry High School.
Ownership History
Date
Name
Owned For
Owner Type
Purchase Details
Closed on
Apr 11, 2025
Sold by
Roth Jeffrey Kirk and Roth Katie Lou
Bought by
Bullish Real Estate Group Llc
Current Estimated Value
Purchase Details
Closed on
Nov 14, 2008
Sold by
Archer Edna Shirley
Bought by
Roth Jeffrey Kirk and Roth Katie Lou
Home Financials for this Owner
Home Financials are based on the most recent Mortgage that was taken out on this home.
Original Mortgage
$25,000
Interest Rate
5.79%
Mortgage Type
Future Advance Clause Open End Mortgage
Purchase Details
Closed on
Jun 16, 1997
Sold by
Archer Edna Shirley
Bought by
Archer Edna Shirley
Purchase Details
Closed on
Jan 1, 1986
Sold by
Archer Paul Donald and Archer Edna
Bought by
Archer Paul Donald and Archer Edna
Create a Home Valuation Report for This Property
The Home Valuation Report is an in-depth analysis detailing your home's value as well as a comparison with similar homes in the area
Home Values in the Area
Average Home Value in this Area
Purchase History
| Date | Buyer | Sale Price | Title Company |
|---|---|---|---|
| Bullish Real Estate Group Llc | $6,666 | None Listed On Document | |
| Bullish Real Estate Group Llc | $6,666 | None Listed On Document | |
| Roth Jeffrey Kirk | $32,800 | Attorney | |
| Archer Edna Shirley | -- | -- | |
| Archer Paul Donald | -- | -- |
Source: Public Records
Mortgage History
| Date | Status | Borrower | Loan Amount |
|---|---|---|---|
| Previous Owner | Roth Jeffrey Kirk | $25,000 |
Source: Public Records
Tax History Compared to Growth
Tax History
| Year | Tax Paid | Tax Assessment Tax Assessment Total Assessment is a certain percentage of the fair market value that is determined by local assessors to be the total taxable value of land and additions on the property. | Land | Improvement |
|---|---|---|---|---|
| 2024 | $927 | $22,570 | $3,060 | $19,510 |
| 2023 | $697 | $15,550 | $1,510 | $14,040 |
| 2022 | $697 | $15,550 | $1,508 | $14,042 |
| 2021 | $693 | $15,550 | $1,508 | $14,042 |
| 2020 | $650 | $13,520 | $1,310 | $12,210 |
| 2019 | $652 | $13,520 | $1,310 | $12,210 |
| 2018 | $698 | $13,520 | $1,310 | $12,210 |
| 2017 | $635 | $13,360 | $2,490 | $10,870 |
| 2016 | $640 | $13,360 | $2,490 | $10,870 |
| 2015 | $577 | $13,360 | $2,490 | $10,870 |
| 2014 | $551 | $12,610 | $2,260 | $10,350 |
| 2013 | $518 | $12,610 | $2,260 | $10,350 |
Source: Public Records
Map
Nearby Homes