Estimated Value: $173,000 - $264,000
3
Beds
1
Bath
1,848
Sq Ft
$117/Sq Ft
Est. Value
About This Home
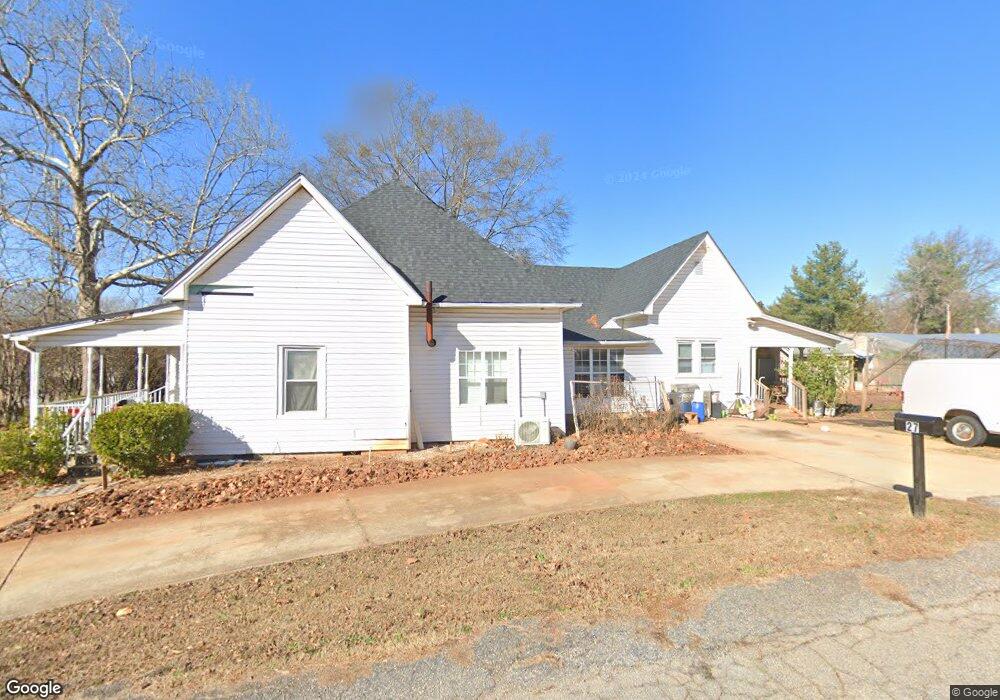
This home is located at 27 S Howard St, Inman, SC 29349 and is currently estimated at $216,717, approximately $117 per square foot. 27 S Howard St is a home located in Spartanburg County with nearby schools including Inman Elementary School, T.E. Mabry Middle School, and Chapman High School.
Ownership History
Date
Name
Owned For
Owner Type
Purchase Details
Closed on
Aug 4, 2006
Sold by
Duong Lek
Bought by
Chhouen Somsith
Current Estimated Value
Home Financials for this Owner
Home Financials are based on the most recent Mortgage that was taken out on this home.
Original Mortgage
$67,500
Outstanding Balance
$47,574
Interest Rate
10.25%
Mortgage Type
Adjustable Rate Mortgage/ARM
Estimated Equity
$169,143
Purchase Details
Closed on
Aug 1, 2006
Sold by
George Emma R
Bought by
Expo Of South Carolina Llc
Home Financials for this Owner
Home Financials are based on the most recent Mortgage that was taken out on this home.
Original Mortgage
$67,500
Outstanding Balance
$47,574
Interest Rate
10.25%
Mortgage Type
Adjustable Rate Mortgage/ARM
Estimated Equity
$169,143
Purchase Details
Closed on
Aug 13, 2004
Sold by
Duong Lek
Bought by
Duong Lek and Chhouen Somsith
Purchase Details
Closed on
Nov 20, 2003
Sold by
Patrick Joyce J
Bought by
Patrick Joyce J and Patrick Clyde
Create a Home Valuation Report for This Property
The Home Valuation Report is an in-depth analysis detailing your home's value as well as a comparison with similar homes in the area
Home Values in the Area
Average Home Value in this Area
Purchase History
| Date | Buyer | Sale Price | Title Company |
|---|---|---|---|
| Chhouen Somsith | -- | Capital Title Agency | |
| Expo Of South Carolina Llc | $125,000 | None Available | |
| Duong Lek | -- | -- | |
| Duong Lek | $65,000 | -- | |
| Patrick Joyce J | -- | -- |
Source: Public Records
Mortgage History
| Date | Status | Borrower | Loan Amount |
|---|---|---|---|
| Open | Chhouen Somsith | $67,500 |
Source: Public Records
Tax History Compared to Growth
Tax History
| Year | Tax Paid | Tax Assessment Tax Assessment Total Assessment is a certain percentage of the fair market value that is determined by local assessors to be the total taxable value of land and additions on the property. | Land | Improvement |
|---|---|---|---|---|
| 2025 | $2,730 | $5,817 | $788 | $5,029 |
| 2024 | $2,730 | $5,817 | $788 | $5,029 |
| 2023 | $2,730 | $5,817 | $788 | $5,029 |
| 2022 | $2,463 | $5,058 | $594 | $4,464 |
| 2021 | $2,437 | $5,058 | $594 | $4,464 |
| 2020 | $2,408 | $5,058 | $594 | $4,464 |
| 2019 | $2,423 | $5,058 | $594 | $4,464 |
| 2018 | $2,408 | $5,058 | $594 | $4,464 |
| 2017 | $1,970 | $4,209 | $574 | $3,635 |
| 2016 | $1,939 | $4,209 | $574 | $3,635 |
| 2015 | $1,934 | $4,209 | $574 | $3,635 |
| 2014 | $1,901 | $4,209 | $574 | $3,635 |
Source: Public Records
Map
Nearby Homes