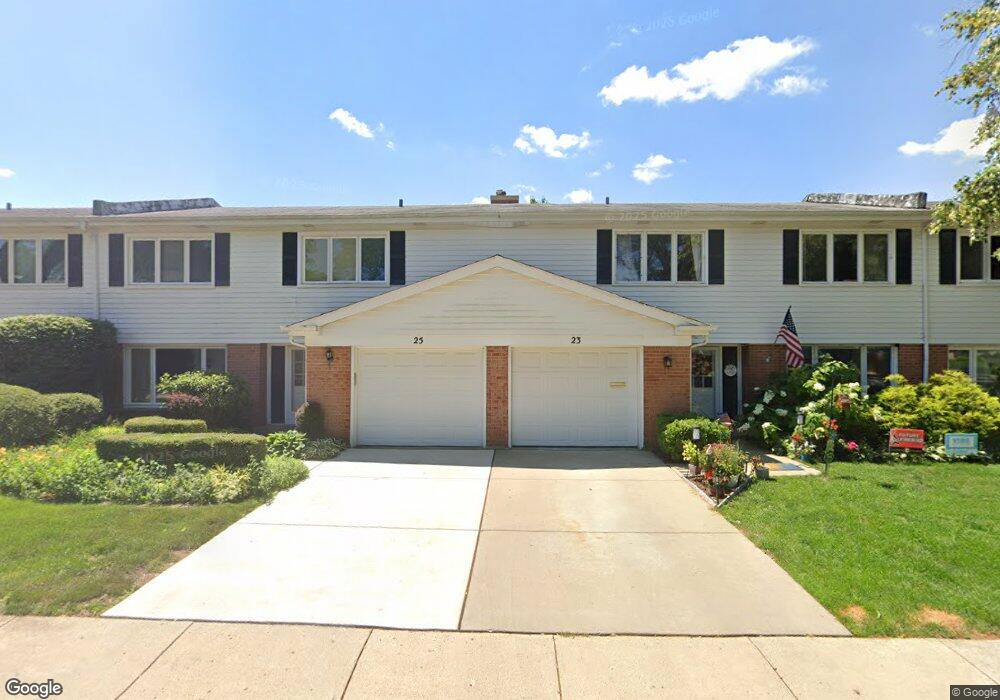
27 S Regency Ct W Arlington Heights, IL 60004
Estimated Value: $394,000 - $420,410
3
Beds
2
Baths
1,785
Sq Ft
$227/Sq Ft
Est. Value
About This Home
This home is located at 27 S Regency Ct W, Arlington Heights, IL 60004 and is currently estimated at $405,603, approximately $227 per square foot. 27 S Regency Ct W is a home located in Cook County with nearby schools including Dryden Elementary School, South Middle School, and Prospect High School.
Ownership History
Date
Name
Owned For
Owner Type
Purchase Details
Closed on
Dec 13, 2021
Sold by
Sirvatka Martin G and Sirvatka Y
Bought by
Sirvatka Martin G and The Martin G Sirvatka Trust
Current Estimated Value
Purchase Details
Closed on
Aug 11, 1995
Sold by
Pearson Kerry W
Bought by
Sirvatka Martin G
Home Financials for this Owner
Home Financials are based on the most recent Mortgage that was taken out on this home.
Original Mortgage
$148,675
Interest Rate
6.87%
Create a Home Valuation Report for This Property
The Home Valuation Report is an in-depth analysis detailing your home's value as well as a comparison with similar homes in the area
Home Values in the Area
Average Home Value in this Area
Purchase History
| Date | Buyer | Sale Price | Title Company |
|---|---|---|---|
| Sirvatka Martin G | -- | -- | |
| Sirvatka Martin G | -- | -- | |
| Sirvatka Martin G | $152,500 | -- |
Source: Public Records
Mortgage History
| Date | Status | Borrower | Loan Amount |
|---|---|---|---|
| Previous Owner | Sirvatka Martin G | $148,675 |
Source: Public Records
Tax History Compared to Growth
Tax History
| Year | Tax Paid | Tax Assessment Tax Assessment Total Assessment is a certain percentage of the fair market value that is determined by local assessors to be the total taxable value of land and additions on the property. | Land | Improvement |
|---|---|---|---|---|
| 2024 | $7,189 | $32,000 | $5,000 | $27,000 |
| 2023 | $6,877 | $32,000 | $5,000 | $27,000 |
| 2022 | $6,877 | $32,000 | $5,000 | $27,000 |
| 2021 | $6,068 | $23,298 | $1,631 | $21,667 |
| 2020 | $5,977 | $23,298 | $1,631 | $21,667 |
| 2019 | $5,978 | $25,974 | $1,631 | $24,343 |
| 2018 | $6,176 | $24,350 | $1,419 | $22,931 |
| 2017 | $6,120 | $24,350 | $1,419 | $22,931 |
| 2016 | $5,943 | $24,350 | $1,419 | $22,931 |
| 2015 | $5,215 | $20,196 | $1,206 | $18,990 |
| 2014 | $5,061 | $20,196 | $1,206 | $18,990 |
| 2013 | $4,920 | $20,196 | $1,206 | $18,990 |
Source: Public Records
Map
Nearby Homes
- 2700 E Bel Aire Dr Unit 104
- 101 N Peartree Ln Unit 101
- 2405 E Miner St
- 25 N Prindle Ave
- 512 N Prospect Manor Ave
- 719 N Elmhurst Ave
- 428 S Phelps Ave
- 201 S Stratford Rd
- 710 Creekside Dr Unit 506A
- 108 N Meadow Ln
- 1615 E Miner St
- 730 Creekside Dr Unit 405C
- 415 N Russel St
- 706 N Main St
- 1255 W Prospect Ave Unit 208
- 315 N Drury Ln
- 314 N Pine St
- 910 Persimmon Ln Unit A
- 1401 Plum Ct Unit D
- 1311 Nutmeg Ct Unit A
- 25 S Regency Ct W
- 29 S Regency Ct W
- 23 S Regency Ct W
- 21 S Regency Ct W
- 21 S Regency Ct W Unit 21
- 17 S Regency Ct W
- 19 S Regency Ct W
- 15 S Regency Ct W Unit 1
- 9 S Regency Ct W
- 11 S Regency Ct W
- 2639 E Bel Aire Dr
- 7 S Regency Dr W
- 2635 E Bel Aire Dr
- 2643 E Bel Aire Dr
- 2631 E Bel Aire Dr
- 2627 E Bel Aire Dr Unit 1
- 5 S Regency Dr W
- 2609 E Bel Aire Dr
- 2617 E Bel Aire Dr
- 3 S Regency Dr W