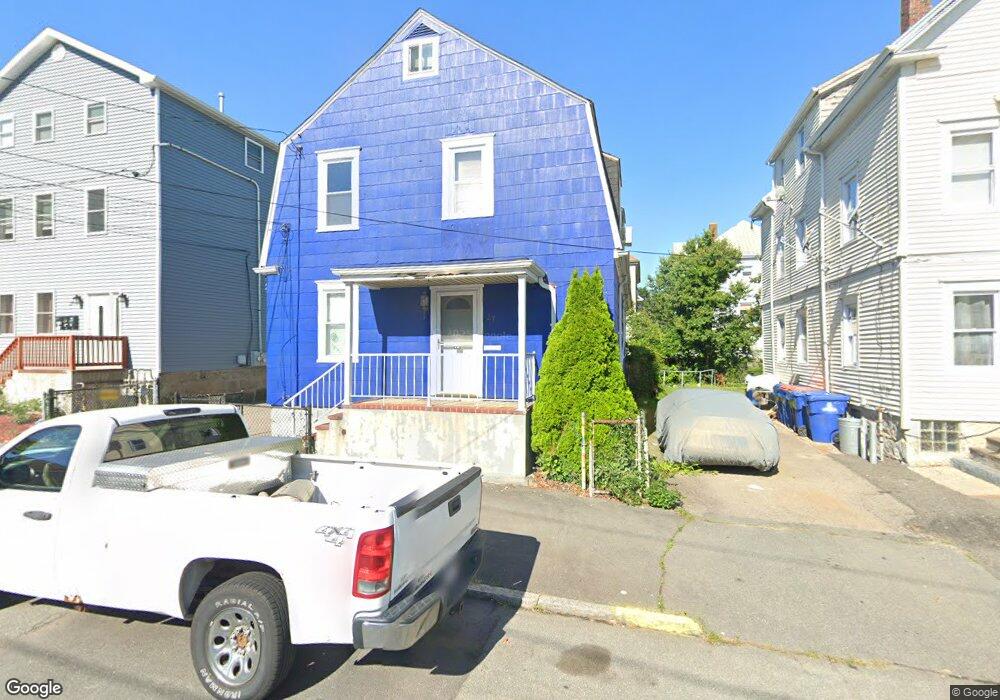
27 Salisbury St New Bedford, MA 02744
The South End NeighborhoodEstimated Value: $442,013 - $513,000
4
Beds
2
Baths
1,920
Sq Ft
$243/Sq Ft
Est. Value
About This Home
This home is located at 27 Salisbury St, New Bedford, MA 02744 and is currently estimated at $467,503, approximately $243 per square foot. 27 Salisbury St is a home located in Bristol County with nearby schools including Irwin M. Jacobs Elementary School, Roosevelt Middle School, and New Bedford High School.
Ownership History
Date
Name
Owned For
Owner Type
Purchase Details
Closed on
Oct 30, 1987
Sold by
Debarros Joao Est
Bought by
Sousa Manuel F
Current Estimated Value
Home Financials for this Owner
Home Financials are based on the most recent Mortgage that was taken out on this home.
Original Mortgage
$60,000
Interest Rate
10.97%
Mortgage Type
Purchase Money Mortgage
Create a Home Valuation Report for This Property
The Home Valuation Report is an in-depth analysis detailing your home's value as well as a comparison with similar homes in the area
Home Values in the Area
Average Home Value in this Area
Purchase History
| Date | Buyer | Sale Price | Title Company |
|---|---|---|---|
| Sousa Manuel F | $93,000 | -- |
Source: Public Records
Mortgage History
| Date | Status | Borrower | Loan Amount |
|---|---|---|---|
| Open | Sousa Manuel F | $52,000 | |
| Closed | Sousa Manuel F | $60,000 |
Source: Public Records
Tax History Compared to Growth
Tax History
| Year | Tax Paid | Tax Assessment Tax Assessment Total Assessment is a certain percentage of the fair market value that is determined by local assessors to be the total taxable value of land and additions on the property. | Land | Improvement |
|---|---|---|---|---|
| 2025 | $4,306 | $380,700 | $77,500 | $303,200 |
| 2024 | $3,902 | $325,200 | $72,600 | $252,600 |
| 2023 | $3,534 | $247,300 | $62,000 | $185,300 |
| 2022 | $3,163 | $202,900 | $56,500 | $146,400 |
| 2021 | $3,163 | $202,900 | $56,500 | $146,400 |
| 2020 | $3,106 | $192,200 | $53,300 | $138,900 |
| 2019 | $3,026 | $183,700 | $53,300 | $130,400 |
| 2018 | $2,872 | $172,700 | $53,300 | $119,400 |
| 2017 | $2,597 | $155,600 | $53,300 | $102,300 |
| 2016 | $2,525 | $153,100 | $54,900 | $98,200 |
| 2015 | $2,380 | $151,300 | $56,500 | $94,800 |
| 2014 | $2,303 | $151,900 | $56,500 | $95,400 |
Source: Public Records
Map
Nearby Homes
- 25 Salisbury St
- 29 Salisbury St
- 29 Salisbury St Unit 3
- 29 Salisbury St Unit 2
- 29 Salisbury St Unit 1
- 28 Viall St
- 31 Salisbury St
- 23 Salisbury St
- 26 Viall St
- 30 Viall St
- 30 Viall St Unit 2nd floor
- 30 Viall St Unit 1
- 24 Viall St
- 32 Viall St
- 107 Ruth St
- 26 Salisbury St
- 26 Salisbury St Unit 2
- 21 Salisbury St
- 28 Salisbury St
- 30 Salisbury St