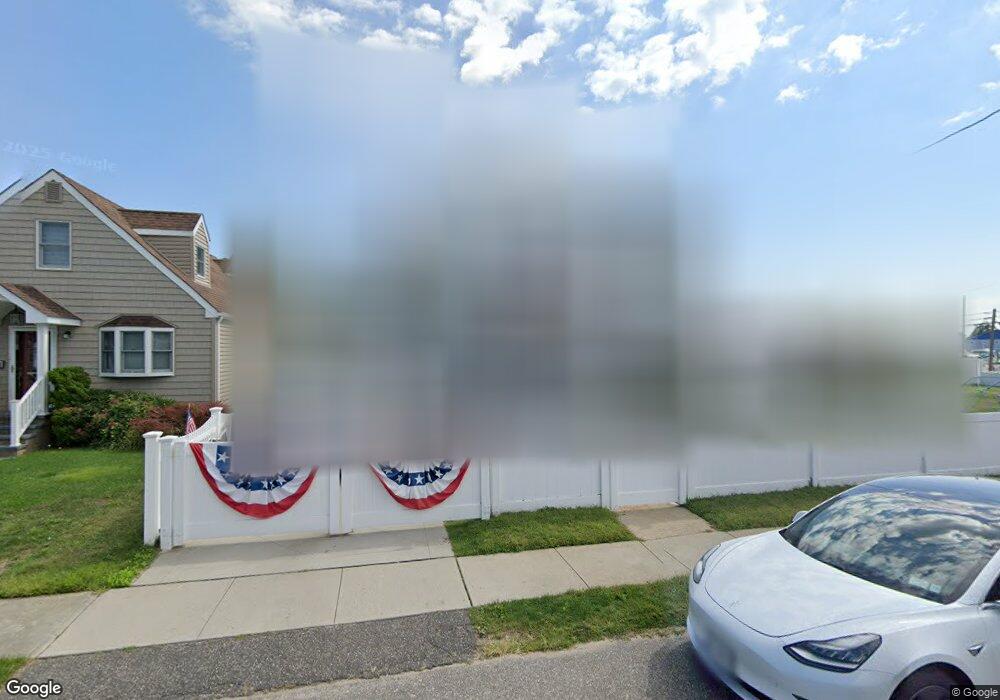
27 Sampson Place Lindenhurst, NY 11757
Estimated Value: $556,057 - $733,000
Studio
--
Bath
1,887
Sq Ft
$326/Sq Ft
Est. Value
About This Home
This home is located at 27 Sampson Place, Lindenhurst, NY 11757 and is currently estimated at $615,264, approximately $326 per square foot. 27 Sampson Place is a home located in Suffolk County with nearby schools including Harding Avenue Elementary School, Lindenhurst Middle School, and Lindenhurst Senior High School.
Ownership History
Date
Name
Owned For
Owner Type
Purchase Details
Closed on
Jan 26, 2005
Sold by
Estate Steiger Eugene P
Bought by
Steiger Kenneth
Current Estimated Value
Purchase Details
Closed on
Mar 24, 2004
Sold by
E I Capital Inc
Bought by
Blue Sky Resources Inc
Purchase Details
Closed on
Jan 29, 2001
Sold by
The Chase Manhattan Bank
Bought by
E L Capital Inc
Home Financials for this Owner
Home Financials are based on the most recent Mortgage that was taken out on this home.
Original Mortgage
$99,000
Interest Rate
15%
Mortgage Type
Stand Alone First
Purchase Details
Closed on
Jan 23, 2001
Sold by
Glasnapp Dominika S and Chiarello Thomas
Bought by
The Chase Manhattan Bank
Home Financials for this Owner
Home Financials are based on the most recent Mortgage that was taken out on this home.
Original Mortgage
$99,000
Interest Rate
15%
Mortgage Type
Stand Alone First
Purchase Details
Closed on
Feb 23, 1996
Sold by
Tamargo Ernesto
Bought by
Chiarello Thomas
Create a Home Valuation Report for This Property
The Home Valuation Report is an in-depth analysis detailing your home's value as well as a comparison with similar homes in the area
Home Values in the Area
Average Home Value in this Area
Purchase History
| Date | Buyer | Sale Price | Title Company |
|---|---|---|---|
| Steiger Kenneth | -- | Leroy Van Nostrand Jr | |
| Blue Sky Resources Inc | -- | -- | |
| E L Capital Inc | $110,000 | Fidelity National Title Ins | |
| The Chase Manhattan Bank | $100,001 | -- | |
| Chiarello Thomas | $120,000 | Lawyers Title Insurance Corp |
Source: Public Records
Mortgage History
| Date | Status | Borrower | Loan Amount |
|---|---|---|---|
| Previous Owner | E L Capital Inc | $99,000 |
Source: Public Records
Tax History
| Year | Tax Paid | Tax Assessment Tax Assessment Total Assessment is a certain percentage of the fair market value that is determined by local assessors to be the total taxable value of land and additions on the property. | Land | Improvement |
|---|---|---|---|---|
| 2024 | $12,107 | $3,550 | $140 | $3,410 |
| 2023 | $12,107 | $3,550 | $140 | $3,410 |
| 2022 | $11,722 | $3,550 | $140 | $3,410 |
| 2021 | $11,722 | $3,550 | $140 | $3,410 |
| 2020 | $10,812 | $3,550 | $140 | $3,410 |
| 2019 | $10,812 | $0 | $0 | $0 |
| 2018 | -- | $3,550 | $140 | $3,410 |
| 2017 | $10,233 | $3,550 | $140 | $3,410 |
| 2016 | $10,267 | $3,550 | $140 | $3,410 |
| 2015 | -- | $3,550 | $140 | $3,410 |
| 2014 | -- | $3,550 | $140 | $3,410 |
Source: Public Records
Map
Nearby Homes
- 248 E Shore Rd
- 250 Wyona Ave
- 219 Granada Pkwy
- 750 Shore Walk
- 20 Wyona Ave
- 243 Lido Pkwy
- 613 Madison Ave
- 222 Lido Pkwy
- 630 S Wellwood Ave
- 390 E Shore Rd
- 356 Granada Pkwy
- 6 Gail Grace Ct
- 173 Davenport St
- 351 Venetian Blvd
- 502 S Wellwood Ave
- 15 Snapper Ct
- 816 Narragansett Villas Dr Unit 816
- 604 Narragansett Villas Dr
- 817 Ocean St
- 512 Narragansett Villas Dr
- 23 Sampson Place
- 21 Sampson Place
- 32 Schley Ave
- 20 Schley Ave
- 167 E Shore Rd
- 139 E Shore Rd
- 11 Sampson Place
- 24 Sampson Place
- 24 Schley Ave
- 20 Sampson Place
- 131 E Shore Rd
- 26 Schley Ave
- 7 Sampson Place
- 10 Sampson Place
- 25 Schley Ave
- 27 Schley Ave
- 24 Dewey Place
- 22 Schley Ave
- 123 E Shore Rd
- 19 Dewey Place
Your Personal Tour Guide
Ask me questions while you tour the home.