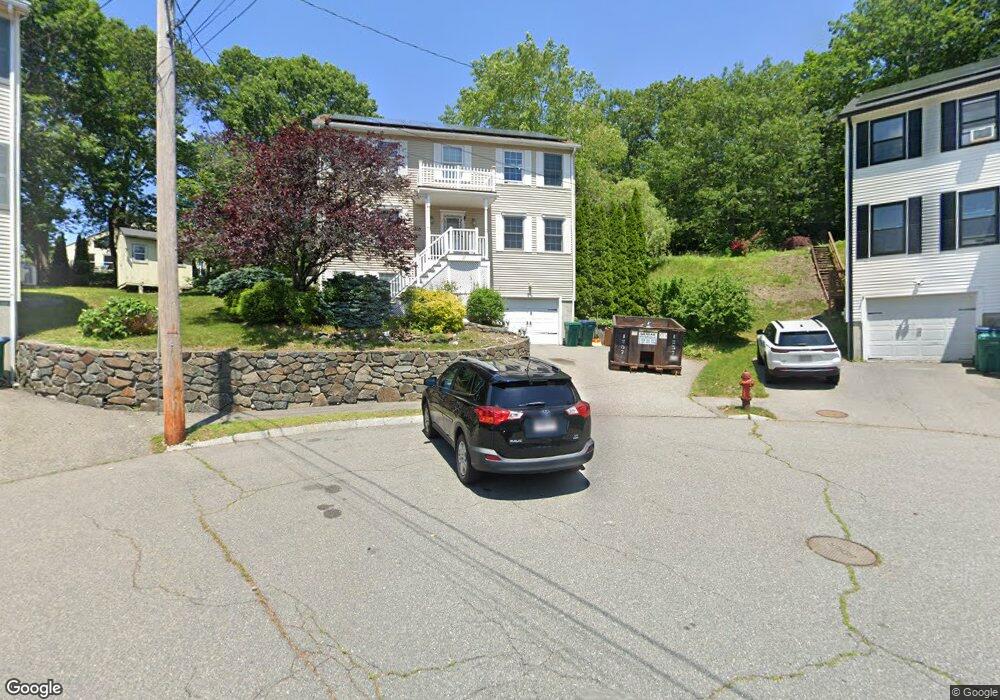
27 Savoy St Lynn, MA 01904
Fays Estate NeighborhoodEstimated Value: $766,118 - $827,000
4
Beds
2
Baths
2,016
Sq Ft
$395/Sq Ft
Est. Value
About This Home
This home is located at 27 Savoy St, Lynn, MA 01904 and is currently estimated at $795,780, approximately $394 per square foot. 27 Savoy St is a home located in Essex County with nearby schools including Aborn Elementary School, William R. Fallon School, and Pickering Middle School.
Ownership History
Date
Name
Owned For
Owner Type
Purchase Details
Closed on
Apr 19, 2016
Sold by
Bennett Rt
Bought by
Bennett Gladstone G and Gayle-Bennett Andrea
Current Estimated Value
Purchase Details
Closed on
Jul 24, 2013
Sold by
Bennett Gladstone G and Gayle-Bennett Andrea
Bought by
Bennett Rt and Bennett Gladstone G
Purchase Details
Closed on
Jun 20, 2000
Sold by
Delvecchio Inc
Bought by
Bennett Gladstone G and Gayle-Bennett Andrea
Create a Home Valuation Report for This Property
The Home Valuation Report is an in-depth analysis detailing your home's value as well as a comparison with similar homes in the area
Home Values in the Area
Average Home Value in this Area
Purchase History
| Date | Buyer | Sale Price | Title Company |
|---|---|---|---|
| Bennett Gladstone G | -- | -- | |
| Gladstone G Bebbett Re | -- | -- | |
| Bennett Rt | -- | -- | |
| Bennett Gladstone G | $269,000 | -- |
Source: Public Records
Mortgage History
| Date | Status | Borrower | Loan Amount |
|---|---|---|---|
| Previous Owner | Bennett Gladstone G | $284,175 | |
| Previous Owner | Bennett Gladstone G | $286,300 |
Source: Public Records
Tax History
| Year | Tax Paid | Tax Assessment Tax Assessment Total Assessment is a certain percentage of the fair market value that is determined by local assessors to be the total taxable value of land and additions on the property. | Land | Improvement |
|---|---|---|---|---|
| 2025 | $7,954 | $767,800 | $219,100 | $548,700 |
| 2024 | $7,594 | $721,200 | $210,100 | $511,100 |
| 2023 | $7,231 | $648,500 | $199,600 | $448,900 |
| 2022 | $7,173 | $577,100 | $165,900 | $411,200 |
| 2021 | $6,653 | $510,600 | $150,600 | $360,000 |
| 2020 | $6,679 | $498,400 | $154,000 | $344,400 |
| 2019 | $6,675 | $466,800 | $146,900 | $319,900 |
| 2018 | $6,392 | $421,900 | $143,600 | $278,300 |
| 2017 | $6,087 | $390,200 | $127,900 | $262,300 |
| 2016 | $5,770 | $356,600 | $110,300 | $246,300 |
| 2015 | $5,554 | $331,600 | $108,900 | $222,700 |
Source: Public Records
Map
Nearby Homes
- 38 Ledgemont Ln
- 73 Lockwood Rd
- 31 Atkins Ave
- 21 E Park Ave
- 91 Oakwood Ave
- 431-433 Chatham St
- 19 Gage St
- 16 Clinton St
- 6A Goodridge St
- 27-29 Graves Ave
- 11 Urban St
- 40 Archer St
- 16 Isabella St
- 22 Strongwater Dr
- 50 Webster St
- 18 Strongwater Dr
- 18 Kittredge St
- 11 Strongwater Dr
- 1 Clough St
- 10 Fairview Rd
Your Personal Tour Guide
Ask me questions while you tour the home.