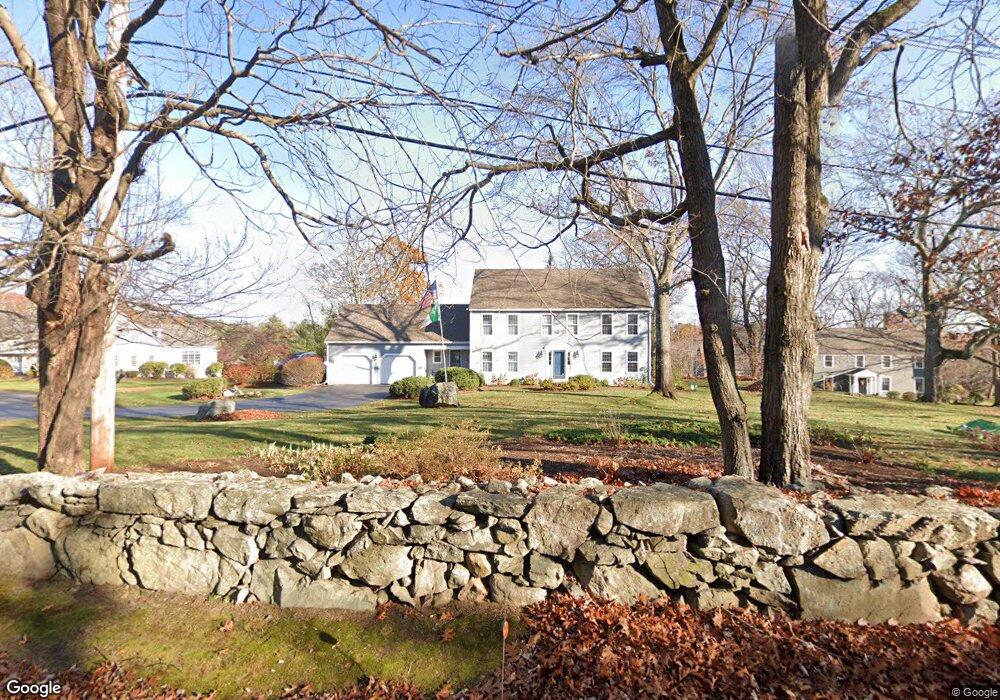
27 Sears Rd Southborough, MA 01772
Estimated Value: $1,220,783 - $1,429,000
4
Beds
3
Baths
2,960
Sq Ft
$442/Sq Ft
Est. Value
About This Home
This home is located at 27 Sears Rd, Southborough, MA 01772 and is currently estimated at $1,308,261, approximately $441 per square foot. 27 Sears Rd is a home located in Worcester County with nearby schools including Albert S. Woodward Memorial School, Margaret A. Neary School, and P. Brent Trottier Middle School.
Ownership History
Date
Name
Owned For
Owner Type
Purchase Details
Closed on
Jun 27, 2016
Sold by
Higgins Timothy and Higgins Diane
Bought by
Timothy J Higgins Ret
Current Estimated Value
Purchase Details
Closed on
Mar 27, 1984
Bought by
Higgins Timothy and Higgins Diane
Create a Home Valuation Report for This Property
The Home Valuation Report is an in-depth analysis detailing your home's value as well as a comparison with similar homes in the area
Home Values in the Area
Average Home Value in this Area
Purchase History
| Date | Buyer | Sale Price | Title Company |
|---|---|---|---|
| Timothy J Higgins Ret | -- | -- | |
| Higgins Timothy | $230,000 | -- |
Source: Public Records
Mortgage History
| Date | Status | Borrower | Loan Amount |
|---|---|---|---|
| Previous Owner | Higgins Timothy | $200,000 | |
| Previous Owner | Higgins Timothy | $125,900 | |
| Previous Owner | Higgins Timothy | $150,000 | |
| Previous Owner | Higgins Timothy | $200,000 |
Source: Public Records
Tax History Compared to Growth
Tax History
| Year | Tax Paid | Tax Assessment Tax Assessment Total Assessment is a certain percentage of the fair market value that is determined by local assessors to be the total taxable value of land and additions on the property. | Land | Improvement |
|---|---|---|---|---|
| 2025 | $16,670 | $1,207,100 | $505,600 | $701,500 |
| 2024 | $15,636 | $1,124,100 | $495,100 | $629,000 |
| 2023 | $14,823 | $1,004,300 | $463,300 | $541,000 |
| 2022 | $13,926 | $855,400 | $405,000 | $450,400 |
| 2021 | $4,698 | $832,900 | $393,800 | $439,100 |
| 2020 | $13,210 | $792,900 | $368,000 | $424,900 |
| 2019 | $12,876 | $769,200 | $358,400 | $410,800 |
| 2018 | $12,257 | $759,400 | $362,200 | $397,200 |
| 2017 | $12,210 | $745,400 | $362,200 | $383,200 |
| 2016 | $12,297 | $777,300 | $362,300 | $415,000 |
| 2015 | $12,440 | $776,500 | $367,100 | $409,400 |
Source: Public Records
Map
Nearby Homes
- Lot 2 Quinn Rd
- lot 1 Sears Rd
- 14 Wolfpen Ln
- 14 Lovers Ln
- 150 Framingham Rd
- 15 Lovers Ln
- 20 Clifford Rd
- 6 Eastbrook Farm Ln
- 58 Framingham Rd
- 36 E Main St
- 9 John Matthews Rd
- 39 Desimone Dr
- 43 Stearns Rd
- 11 Whispering Brook Rd Unit 55
- 11 Skylar Dr
- 8 Rock Spring Ln
- 58 Walker St
- 146 Framingham Rd
- 7 John St
- 8 Lorenzo Dr