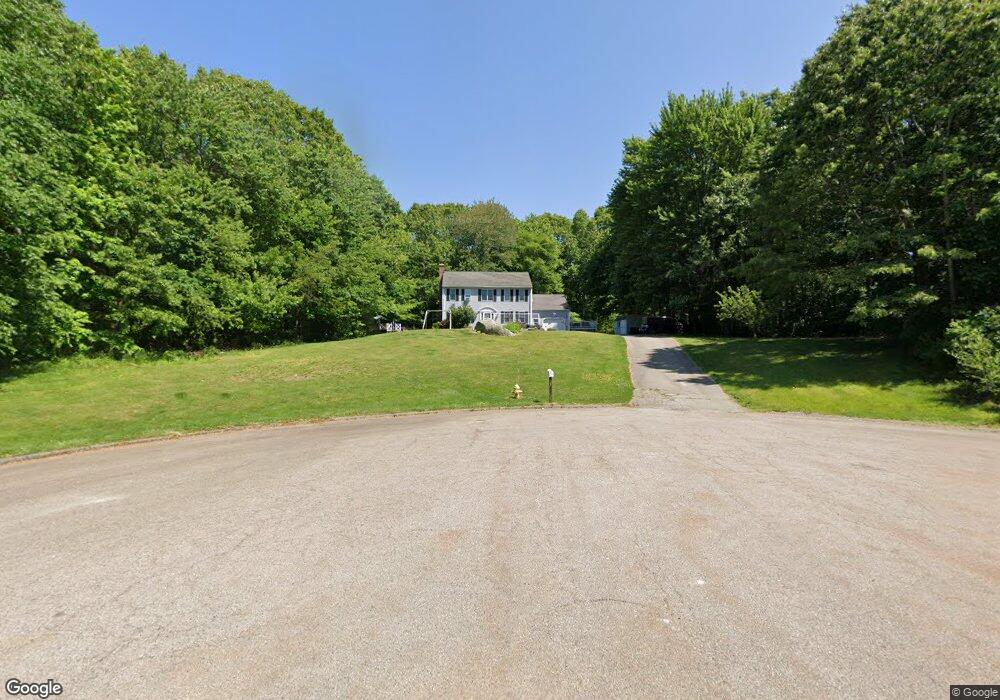
27 Sequoia Ln Uxbridge, MA 01569
Estimated Value: $614,000 - $739,000
4
Beds
3
Baths
2,074
Sq Ft
$326/Sq Ft
Est. Value
About This Home
This home is located at 27 Sequoia Ln, Uxbridge, MA 01569 and is currently estimated at $675,254, approximately $325 per square foot. 27 Sequoia Ln is a home located in Worcester County with nearby schools including Uxbridge High School and Our Lady of the Valley Regional School.
Ownership History
Date
Name
Owned For
Owner Type
Purchase Details
Closed on
Mar 26, 2009
Sold by
Gould Stephen R and Curci Nicole M
Bought by
Corcoran Sarah A
Current Estimated Value
Home Financials for this Owner
Home Financials are based on the most recent Mortgage that was taken out on this home.
Original Mortgage
$324,768
Outstanding Balance
$204,841
Interest Rate
5.14%
Mortgage Type
Purchase Money Mortgage
Estimated Equity
$470,413
Purchase Details
Closed on
Jun 23, 2006
Sold by
Regan Jane M and Regan Michael P
Bought by
Curci Nicole M and Gould Stephen R
Home Financials for this Owner
Home Financials are based on the most recent Mortgage that was taken out on this home.
Original Mortgage
$316,000
Interest Rate
6.59%
Mortgage Type
Purchase Money Mortgage
Purchase Details
Closed on
Jun 29, 2001
Sold by
Afco Land&Dev Corp
Bought by
Regan Michael P and Regan Jane M
Create a Home Valuation Report for This Property
The Home Valuation Report is an in-depth analysis detailing your home's value as well as a comparison with similar homes in the area
Home Values in the Area
Average Home Value in this Area
Purchase History
| Date | Buyer | Sale Price | Title Company |
|---|---|---|---|
| Corcoran Sarah A | $315,000 | -- | |
| Curci Nicole M | $396,000 | -- | |
| Regan Michael P | $259,000 | -- |
Source: Public Records
Mortgage History
| Date | Status | Borrower | Loan Amount |
|---|---|---|---|
| Open | Corcoran Sarah A | $324,768 | |
| Previous Owner | Curci Nicole M | $316,000 | |
| Previous Owner | Regan Michael P | $205,000 | |
| Previous Owner | Regan Michael P | $190,313 | |
| Previous Owner | Regan Michael P | $190,000 |
Source: Public Records
Tax History
| Year | Tax Paid | Tax Assessment Tax Assessment Total Assessment is a certain percentage of the fair market value that is determined by local assessors to be the total taxable value of land and additions on the property. | Land | Improvement |
|---|---|---|---|---|
| 2025 | $6,307 | $481,100 | $153,500 | $327,600 |
| 2024 | $5,977 | $462,600 | $145,700 | $316,900 |
| 2023 | $5,694 | $408,200 | $126,000 | $282,200 |
| 2022 | $5,145 | $339,400 | $110,300 | $229,100 |
| 2021 | $5,331 | $337,000 | $107,900 | $229,100 |
| 2020 | $5,601 | $334,600 | $106,400 | $228,200 |
| 2019 | $5,549 | $319,800 | $106,400 | $213,400 |
| 2018 | $5,522 | $321,600 | $106,400 | $215,200 |
| 2017 | $5,125 | $302,200 | $104,100 | $198,100 |
| 2016 | $5,264 | $299,600 | $95,400 | $204,200 |
| 2015 | $5,138 | $295,300 | $95,400 | $199,900 |
Source: Public Records
Map
Nearby Homes
- 57 Kempton Rd
- 51 Albee Rd
- 127 Old Millville Rd
- 90 Chestnut Hill Rd
- 179 Thayer St
- 18 Chestnut Hill Rd
- 53 Asylum St
- 81 Thayer St
- 220 Millville Rd
- 13A Asylum St
- 70 Chocolog Rd
- 342 Chestnut St
- 314 Richardson St
- 197 Crownshield Ave Unit 16B
- 197 Crownshield Ave Unit 16A
- 197 Crownshield Ave Unit 16C
- 183-183R Mendon St
- 111 Cider Mill Rd
- 57 Chestnut St
- 27 Liberty Hill Dr
Your Personal Tour Guide
Ask me questions while you tour the home.