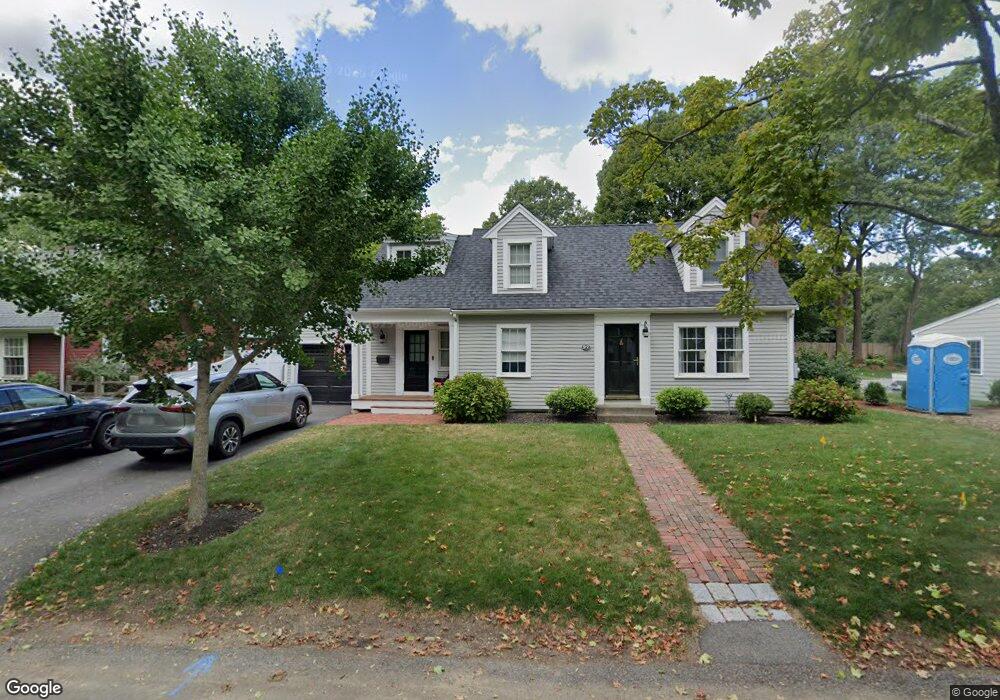
27 Sherwood Rd Hingham, MA 02043
Estimated Value: $1,148,000 - $1,589,558
3
Beds
3
Baths
2,950
Sq Ft
$478/Sq Ft
Est. Value
About This Home
This home is located at 27 Sherwood Rd, Hingham, MA 02043 and is currently estimated at $1,411,390, approximately $478 per square foot. 27 Sherwood Rd is a home located in Plymouth County with nearby schools including Plymouth River Elementary School, Hingham Middle School, and Hingham High School.
Ownership History
Date
Name
Owned For
Owner Type
Purchase Details
Closed on
Feb 27, 2002
Sold by
Tyrcha Jeffrey A and Jewell Paula R
Bought by
Dalimonte Robert and Dalimonte Barbara
Current Estimated Value
Purchase Details
Closed on
Mar 31, 1997
Sold by
Leahy Edward W and Leahy Anne M
Bought by
Tyrcha Jeffrey A and Jewell Paula R
Create a Home Valuation Report for This Property
The Home Valuation Report is an in-depth analysis detailing your home's value as well as a comparison with similar homes in the area
Purchase History
We collect this data history from publicly available records. To have your information removed, we recommend requesting removal directly through your county’s website.
| Date | Buyer | Sale Price | Title Company |
|---|---|---|---|
| Dalimonte Robert | $460,000 | -- | |
| Tyrcha Jeffrey A | $256,000 | -- |
Source: Public Records
Mortgage History
We collect this data history from publicly available records. To have your information removed, we recommend requesting removal directly through your county’s website.
| Date | Status | Borrower | Loan Amount |
|---|---|---|---|
| Open | Tyrcha Jeffrey A | $120,000 | |
| Open | Tyrcha Jeffrey A | $355,000 |
Source: Public Records
Tax History
| Year | Tax Paid | Tax Assessment Tax Assessment Total Assessment is a certain percentage of the fair market value that is determined by local assessors to be the total taxable value of land and additions on the property. | Land | Improvement |
|---|---|---|---|---|
| 2025 | $12,859 | $1,202,900 | $544,000 | $658,900 |
| 2024 | $12,262 | $1,130,100 | $544,000 | $586,100 |
| 2023 | $10,510 | $1,051,000 | $544,000 | $507,000 |
| 2022 | $10,043 | $868,800 | $453,300 | $415,500 |
| 2021 | $9,808 | $831,200 | $472,200 | $359,000 |
| 2020 | $9,076 | $787,200 | $472,200 | $315,000 |
| 2019 | $8,964 | $759,000 | $472,200 | $286,800 |
| 2018 | $4,883 | $712,800 | $377,800 | $335,000 |
| 2017 | $7,577 | $618,500 | $361,100 | $257,400 |
| 2016 | $7,510 | $601,300 | $343,900 | $257,400 |
| 2015 | $7,329 | $584,900 | $327,500 | $257,400 |
Source: Public Records
Map
Nearby Homes
Your Personal Tour Guide
Ask me questions while you tour the home.