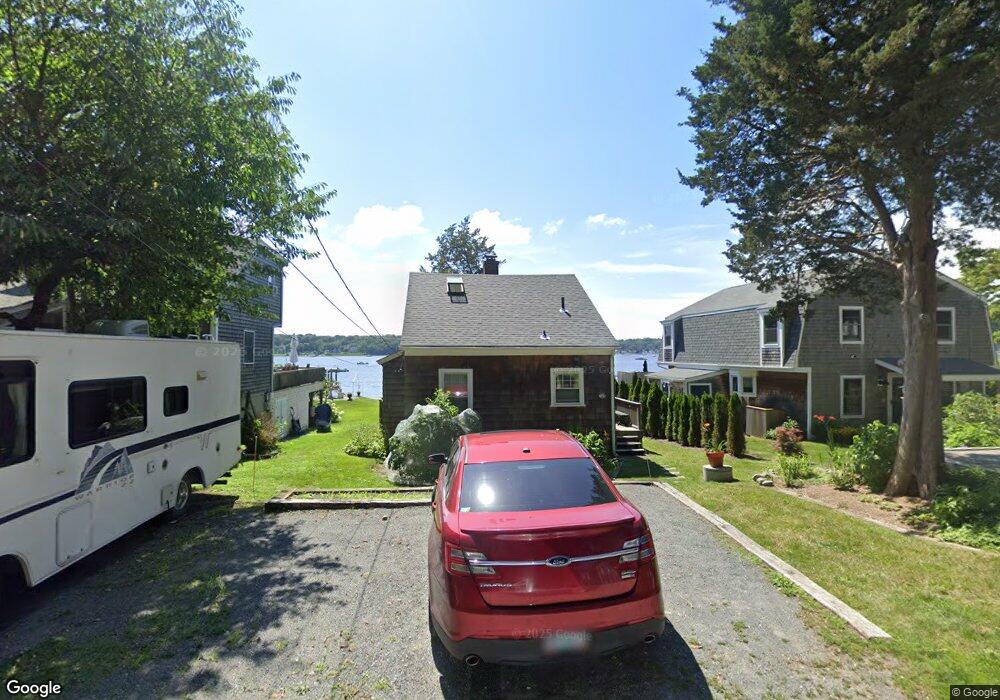
27 Shore Dr Warren, RI 02885
Touisset Highlands NeighborhoodEstimated Value: $567,000 - $1,259,000
3
Beds
2
Baths
780
Sq Ft
$1,068/Sq Ft
Est. Value
About This Home
This home is located at 27 Shore Dr, Warren, RI 02885 and is currently estimated at $833,043, approximately $1,068 per square foot. 27 Shore Dr is a home with nearby schools including Mt. Hope High School.
Ownership History
Date
Name
Owned For
Owner Type
Purchase Details
Closed on
Jul 18, 2019
Sold by
Kenny Florence M
Bought by
Kenny Ruth
Current Estimated Value
Purchase Details
Closed on
Aug 23, 1995
Sold by
Leary Monica K and Leary Kevin
Bought by
Kenny Florence M
Purchase Details
Closed on
Sep 29, 1992
Sold by
Kurgansky Maureen K
Bought by
Leary Kevin J and Leary Monica
Home Financials for this Owner
Home Financials are based on the most recent Mortgage that was taken out on this home.
Original Mortgage
$96,000
Interest Rate
7.9%
Create a Home Valuation Report for This Property
The Home Valuation Report is an in-depth analysis detailing your home's value as well as a comparison with similar homes in the area
Home Values in the Area
Average Home Value in this Area
Purchase History
| Date | Buyer | Sale Price | Title Company |
|---|---|---|---|
| Kenny Ruth | -- | -- | |
| Kenny Florence M | $140,000 | -- | |
| Leary Kevin J | $120,000 | -- |
Source: Public Records
Mortgage History
| Date | Status | Borrower | Loan Amount |
|---|---|---|---|
| Previous Owner | Leary Kevin J | $96,000 |
Source: Public Records
Tax History Compared to Growth
Tax History
| Year | Tax Paid | Tax Assessment Tax Assessment Total Assessment is a certain percentage of the fair market value that is determined by local assessors to be the total taxable value of land and additions on the property. | Land | Improvement |
|---|---|---|---|---|
| 2025 | $8,879 | $596,300 | $464,400 | $131,900 |
| 2024 | $8,611 | $596,300 | $464,400 | $131,900 |
| 2023 | $8,145 | $596,300 | $464,400 | $131,900 |
| 2022 | $7,321 | $406,500 | $324,900 | $81,600 |
| 2021 | $7,203 | $406,500 | $324,900 | $81,600 |
| 2020 | $7,057 | $406,500 | $324,900 | $81,600 |
| 2019 | $7,130 | $373,100 | $301,400 | $71,700 |
| 2018 | $7,037 | $373,100 | $301,400 | $71,700 |
| 2017 | $7,018 | $373,100 | $301,400 | $71,700 |
| 2016 | $6,594 | $330,200 | $255,900 | $74,300 |
| 2015 | $6,594 | $330,200 | $255,900 | $74,300 |
| 2014 | $6,627 | $330,200 | $255,900 | $74,300 |
Source: Public Records
Map
Nearby Homes