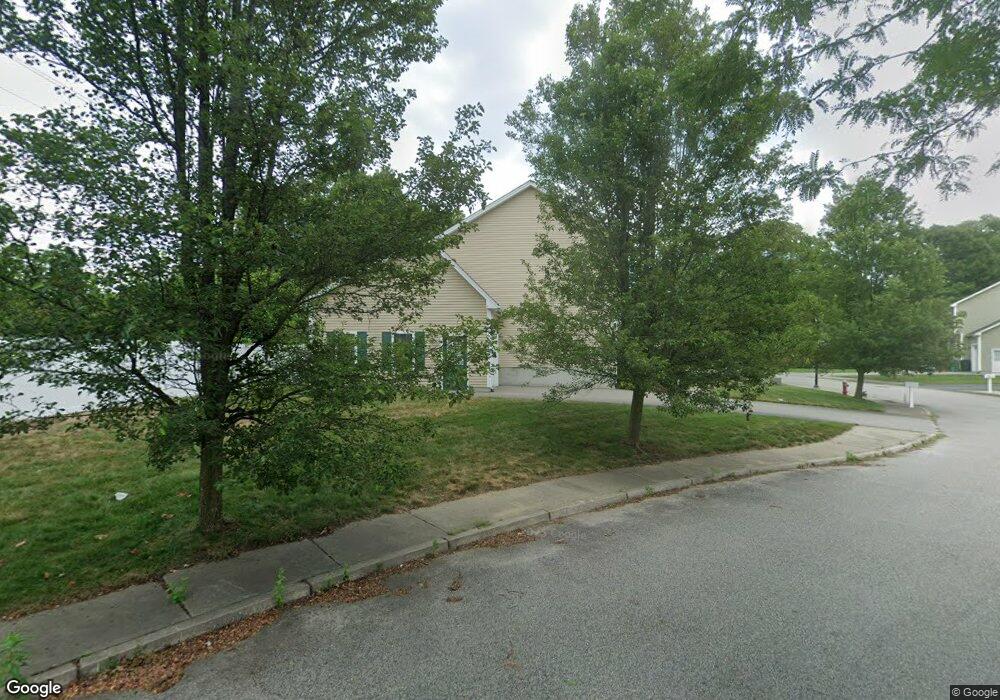
27 Smile Ct Warwick, RI 02889
Long Meadow NeighborhoodEstimated Value: $486,844 - $566,000
3
Beds
2
Baths
1,605
Sq Ft
$340/Sq Ft
Est. Value
About This Home
This home is located at 27 Smile Ct, Warwick, RI 02889 and is currently estimated at $545,461, approximately $339 per square foot. 27 Smile Ct is a home located in Kent County with nearby schools including Saint Kevin School and Bishop Hendricken High School.
Ownership History
Date
Name
Owned For
Owner Type
Purchase Details
Closed on
Jan 19, 2023
Sold by
Moore Walter and Moore Comfort
Bought by
Moore Lt and Moore
Current Estimated Value
Purchase Details
Closed on
Mar 14, 2008
Sold by
Siesta Homes
Bought by
Moore Walter and Moore Comfort
Home Financials for this Owner
Home Financials are based on the most recent Mortgage that was taken out on this home.
Original Mortgage
$247,920
Interest Rate
5.72%
Mortgage Type
Purchase Money Mortgage
Create a Home Valuation Report for This Property
The Home Valuation Report is an in-depth analysis detailing your home's value as well as a comparison with similar homes in the area
Home Values in the Area
Average Home Value in this Area
Purchase History
| Date | Buyer | Sale Price | Title Company |
|---|---|---|---|
| Moore Lt | -- | None Available | |
| Moore Walter | $309,900 | -- |
Source: Public Records
Mortgage History
| Date | Status | Borrower | Loan Amount |
|---|---|---|---|
| Previous Owner | Moore Walter | $239,150 | |
| Previous Owner | Moore Walter | $247,920 |
Source: Public Records
Tax History Compared to Growth
Tax History
| Year | Tax Paid | Tax Assessment Tax Assessment Total Assessment is a certain percentage of the fair market value that is determined by local assessors to be the total taxable value of land and additions on the property. | Land | Improvement |
|---|---|---|---|---|
| 2025 | $5,591 | $440,200 | $105,300 | $334,900 |
| 2024 | $5,788 | $400,000 | $91,500 | $308,500 |
| 2023 | $5,676 | $400,000 | $91,500 | $308,500 |
| 2022 | $5,720 | $305,400 | $63,800 | $241,600 |
| 2021 | $5,720 | $305,400 | $63,800 | $241,600 |
| 2020 | $5,720 | $305,400 | $63,800 | $241,600 |
| 2019 | $5,720 | $305,400 | $63,800 | $241,600 |
| 2018 | $5,273 | $253,500 | $63,800 | $189,700 |
| 2017 | $5,131 | $253,500 | $63,800 | $189,700 |
| 2016 | $5,131 | $253,500 | $63,800 | $189,700 |
| 2015 | $5,034 | $242,600 | $67,600 | $175,000 |
| 2014 | $4,867 | $242,600 | $67,600 | $175,000 |
| 2013 | $4,801 | $242,600 | $67,600 | $175,000 |
Source: Public Records
Map
Nearby Homes
- 176 Vernon St
- 46 Verndale St
- 81 Yucatan Dr
- 352 Church Ave
- 78 Jennie Ln
- 355 Church Ave
- 700 Sandy Ln Unit 6
- 700 Sandy Ln Unit 17
- 700 Sandy Ln Unit 18
- 700 Sandy Ln Unit 1
- 86 Glen Dr
- 985 Cedar Swamp Rd
- 100 Aurora Dr
- 150 Church Ave
- 136 Sefton Ave
- 41 Dayton Ave
- 26 Dallas Ave
- 62 Ardway Ave
- 12 Lima St
- 418 Lake Shore Dr