27 Spring St Hubbard, OH 44425
Estimated Value: $108,000 - $126,389
About This Home
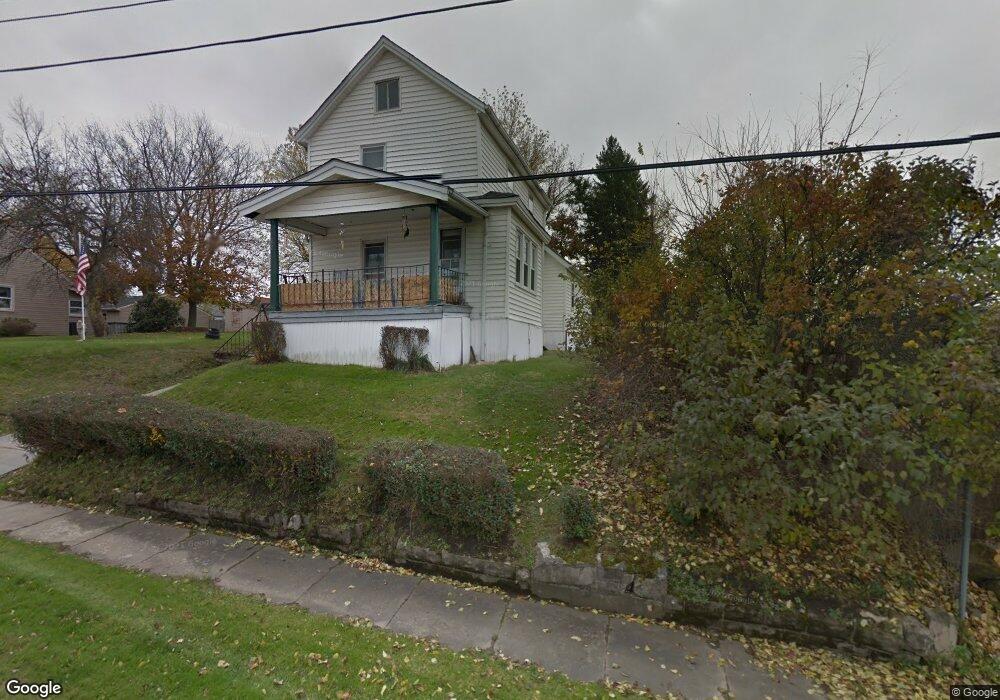
This home is located at 27 Spring St, Hubbard, OH 44425 and is currently estimated at $118,347, approximately $112 per square foot. 27 Spring St is a home located in Trumbull County with nearby schools including Hubbard Elementary School, Hubbard Middle School, and Hubbard High School.
Ownership History
We collect this data history from publicly available records. To have your information removed, we recommend requesting removal directly through your county’s website.
Purchase Details
Purchase Details
Home Financials for this Owner
Home Financials are based on the most recent Mortgage that was taken out on this home.Purchase Details
Purchase Details
Home Values in the Area
Average Home Value in this Area
Purchase History
We collect this data history from publicly available records. To have your information removed, we recommend requesting removal directly through your county’s website.
| Date | Buyer | Sale Price | Title Company |
|---|---|---|---|
| -- | None Available | ||
| -- | -- | ||
| -- | Attorney | ||
| -- | -- |
Mortgage History
We collect this data history from publicly available records. To have your information removed, we recommend requesting removal directly through your county’s website.
| Date | Status | Borrower | Loan Amount |
|---|---|---|---|
| Previous Owner | -- |
Tax History
We collect this data history from publicly available records. To have your information removed, we recommend requesting removal directly through your county’s website.
| Year | Tax Paid | Tax Assessment Tax Assessment Total Assessment is a certain percentage of the fair market value that is determined by local assessors to be the total taxable value of land and additions on the property. | Land | Improvement |
|---|---|---|---|---|
| 2025 | $1,423 | $27,970 | $2,210 | $25,760 |
| 2024 | $1,423 | $27,970 | $2,210 | $25,760 |
| 2023 | $1,398 | $27,970 | $2,210 | $25,760 |
| 2022 | $848 | $15,440 | $2,000 | $13,440 |
| 2021 | $852 | $15,440 | $2,000 | $13,440 |
| 2020 | $855 | $15,440 | $2,000 | $13,440 |
| 2019 | $804 | $13,900 | $2,000 | $11,900 |
| 2018 | $801 | $13,900 | $2,000 | $11,900 |
| 2017 | $799 | $13,900 | $2,000 | $11,900 |
| 2016 | $759 | $14,010 | $2,000 | $12,010 |
| 2015 | $762 | $14,010 | $2,000 | $12,010 |
| 2014 | $745 | $14,010 | $2,000 | $12,010 |
| 2013 | $744 | $14,010 | $2,000 | $12,010 |
Map
- 1029 N Main St
- 701 Jones St
- 404 Elizabeth St
- 344 Myron St Unit 23
- 0 Jackson St
- 134 N Main St
- 561 Rebecca Ave
- 725 Gary Dr
- 949 Saul Dr
- 0 N Main Unit 5204798
- 35 Bentley St
- 323 W Liberty St
- 751 Dresden Dr
- 211 Ashwood Landing
- 160 Hager St
- 1171 Doris Dr
- 135 Clingan St
- 911 Dogwood Dr SE
- 95 Westview Ave
- 547 S Main St
Ask me questions while you tour the home.