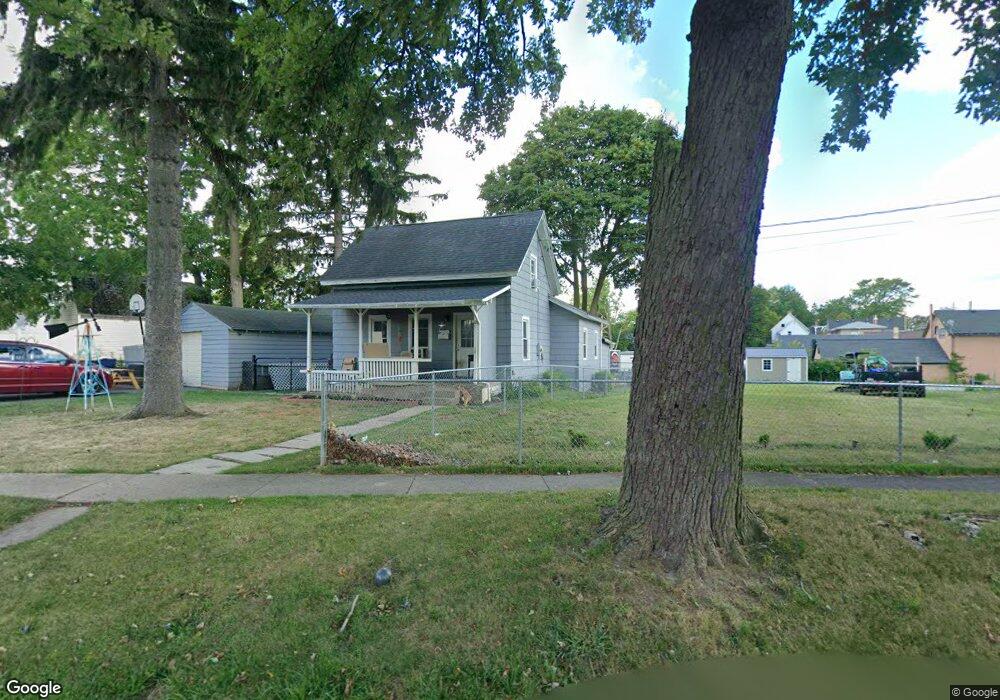
27 Spring St Lockport, NY 14094
Estimated Value: $83,000 - $167,000
3
Beds
1
Bath
1,516
Sq Ft
$85/Sq Ft
Est. Value
About This Home
This home is located at 27 Spring St, Lockport, NY 14094 and is currently estimated at $128,764, approximately $84 per square foot. 27 Spring St is a home located in Niagara County with nearby schools including Aaron Mossell Junior High School, Lockport High School, and DeSales Catholic School.
Ownership History
Date
Name
Owned For
Owner Type
Purchase Details
Closed on
Aug 4, 2022
Sold by
Michael Williamson
Bought by
Luff Robert
Current Estimated Value
Purchase Details
Closed on
Feb 22, 2017
Sold by
Curry Daniel R
Bought by
Williamson Michael and Williamson Tiffany
Purchase Details
Closed on
May 29, 2002
Sold by
Berhalter Kevin R
Bought by
Curry Daniel R
Purchase Details
Closed on
Jan 3, 2002
Sold by
Berhalter Joanne
Bought by
Berhalter Kevin
Purchase Details
Closed on
Dec 18, 2000
Sold by
Berhalter Robert J
Bought by
Berhalter Joanne M
Create a Home Valuation Report for This Property
The Home Valuation Report is an in-depth analysis detailing your home's value as well as a comparison with similar homes in the area
Home Values in the Area
Average Home Value in this Area
Purchase History
| Date | Buyer | Sale Price | Title Company |
|---|---|---|---|
| Luff Robert | $30,000 | None Listed On Document | |
| Williamson Michael | $45,000 | None Available | |
| Curry Daniel R | $12,500 | Henry Schmidt | |
| Berhalter Kevin | -- | -- | |
| Berhalter Joanne M | -- | -- |
Source: Public Records
Tax History
| Year | Tax Paid | Tax Assessment Tax Assessment Total Assessment is a certain percentage of the fair market value that is determined by local assessors to be the total taxable value of land and additions on the property. | Land | Improvement |
|---|---|---|---|---|
| 2024 | $1,712 | $63,000 | $8,900 | $54,100 |
| 2023 | $1,678 | $60,000 | $8,900 | $51,100 |
| 2022 | $1,763 | $75,000 | $8,900 | $66,100 |
| 2021 | $1,625 | $41,200 | $6,400 | $34,800 |
| 2020 | $1,229 | $41,200 | $6,400 | $34,800 |
| 2019 | $356 | $41,200 | $6,400 | $34,800 |
| 2018 | $1,149 | $41,200 | $6,400 | $34,800 |
| 2017 | $351 | $41,200 | $6,400 | $34,800 |
| 2016 | -- | $41,200 | $6,400 | $34,800 |
| 2015 | -- | $41,200 | $6,400 | $34,800 |
| 2014 | -- | $41,200 | $6,400 | $34,800 |
Source: Public Records
Map
Nearby Homes
Your Personal Tour Guide
Ask me questions while you tour the home.