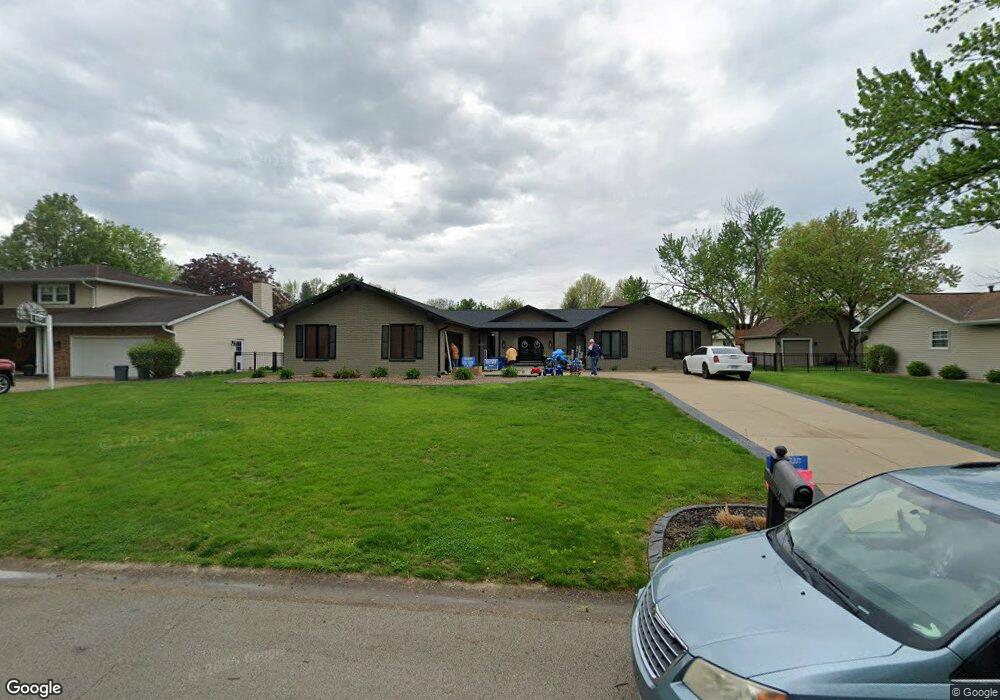
27 Stardust Dr Unit 1 Sherman, IL 62684
Estimated Value: $343,950 - $427,000
3
Beds
3
Baths
2,922
Sq Ft
$125/Sq Ft
Est. Value
About This Home
This home is located at 27 Stardust Dr Unit 1, Sherman, IL 62684 and is currently estimated at $365,738, approximately $125 per square foot. 27 Stardust Dr Unit 1 is a home located in Sangamon County with nearby schools including Sherman Elementary School, Williamsville Jr High School, and Williamsville High School.
Ownership History
Date
Name
Owned For
Owner Type
Purchase Details
Closed on
Mar 21, 2022
Sold by
Geyston John D and Geyston Aimee R
Bought by
Johnson Matthew K and Johnson Brittany A
Current Estimated Value
Home Financials for this Owner
Home Financials are based on the most recent Mortgage that was taken out on this home.
Original Mortgage
$357,130
Outstanding Balance
$322,918
Interest Rate
1.6%
Mortgage Type
New Conventional
Estimated Equity
$42,820
Purchase Details
Closed on
May 7, 2020
Sold by
Gerth Robert E and Gerth Patricia D
Bought by
Geyston John D and Geyston Aimee R
Home Financials for this Owner
Home Financials are based on the most recent Mortgage that was taken out on this home.
Original Mortgage
$238,500
Interest Rate
2.88%
Mortgage Type
New Conventional
Purchase Details
Closed on
Mar 30, 2016
Purchase Details
Closed on
Mar 12, 2010
Purchase Details
Closed on
Oct 1, 2002
Purchase Details
Closed on
Oct 24, 1997
Create a Home Valuation Report for This Property
The Home Valuation Report is an in-depth analysis detailing your home's value as well as a comparison with similar homes in the area
Home Values in the Area
Average Home Value in this Area
Purchase History
| Date | Buyer | Sale Price | Title Company |
|---|---|---|---|
| Johnson Matthew K | $294,000 | None Listed On Document | |
| Geyston John D | $285,000 | Cornerstone Title | |
| -- | $260,000 | -- | |
| -- | $192,000 | -- | |
| -- | -- | -- | |
| -- | -- | -- |
Source: Public Records
Mortgage History
| Date | Status | Borrower | Loan Amount |
|---|---|---|---|
| Open | Johnson Matthew K | $357,130 | |
| Previous Owner | Geyston John D | $238,500 |
Source: Public Records
Tax History
| Year | Tax Paid | Tax Assessment Tax Assessment Total Assessment is a certain percentage of the fair market value that is determined by local assessors to be the total taxable value of land and additions on the property. | Land | Improvement |
|---|---|---|---|---|
| 2024 | $6,121 | $92,164 | $13,765 | $78,399 |
| 2023 | $5,908 | $85,250 | $12,732 | $72,518 |
| 2022 | $5,689 | $79,406 | $11,859 | $67,547 |
| 2021 | $5,634 | $75,704 | $11,306 | $64,398 |
| 2020 | $5,056 | $74,139 | $11,072 | $63,067 |
| 2019 | $4,884 | $73,579 | $10,988 | $62,591 |
| 2018 | $4,774 | $73,155 | $10,925 | $62,230 |
| 2017 | $4,644 | $72,352 | $10,805 | $61,547 |
| 2016 | $4,549 | $70,622 | $10,547 | $60,075 |
| 2015 | $4,441 | $69,702 | $10,410 | $59,292 |
| 2014 | $4,302 | $67,124 | $10,025 | $57,099 |
| 2013 | $4,257 | $66,217 | $9,890 | $56,327 |
Source: Public Records
Map
Nearby Homes
- 520 Vanderbilt Unit 1
- 509 Wingate Dr Unit 1
- 505 Emory Dr Unit 1
- 0 S Sherman Blvd
- 355 Turtle Dove Dr
- 1215 Golf Crest Ct
- 1109 Lightstone Ct
- 1237 Golf Crest Ct
- 1309 Arlington Chase
- 216 Brookside Glen Dr
- 215 Brookside Glen Dr
- 1115 Lost Tree Dr
- 117 Brookside Glen Dr
- 0 Cabin Smoke Trail
- 1317 Arlington Chase
- 20 Hickory Ridge Ln Unit 1
- 101 Illini Blvd
- 105 Illini Blvd
- 14 Timbercrest Dr Unit 1
- 11 Birch Lake Dr Unit 1
- 31 Stardust Dr Unit 1
- 23 Stardust Dr Unit 1
- 19 Stardust Dr Unit 1
- 35 Stardust Dr Unit 1
- 820 Old Tipton School Rd Unit 1
- 840 Old Tipton School Rd Unit 1
- 790 Old Tipton School Rd
- 20 Stardust Dr Unit 1
- 16 Stardust Dr Unit 1
- 24 Stardust Dr Unit 1
- 10 Stardust Dr Unit 1
- 15 Stardust Dr Unit 1
- 39 Stardust Dr Unit 1
- 28 Stardust Dr Unit 1
- 8 Stardust Dr Unit 1
- 724 Old Tipton School Rd Unit 1
- 9 Stardust Dr Unit 1
- 43 Stardust Dr Unit 1
- 32 Stardust Dr Unit 1
- 818 Evergreen Walk
Your Personal Tour Guide
Ask me questions while you tour the home.