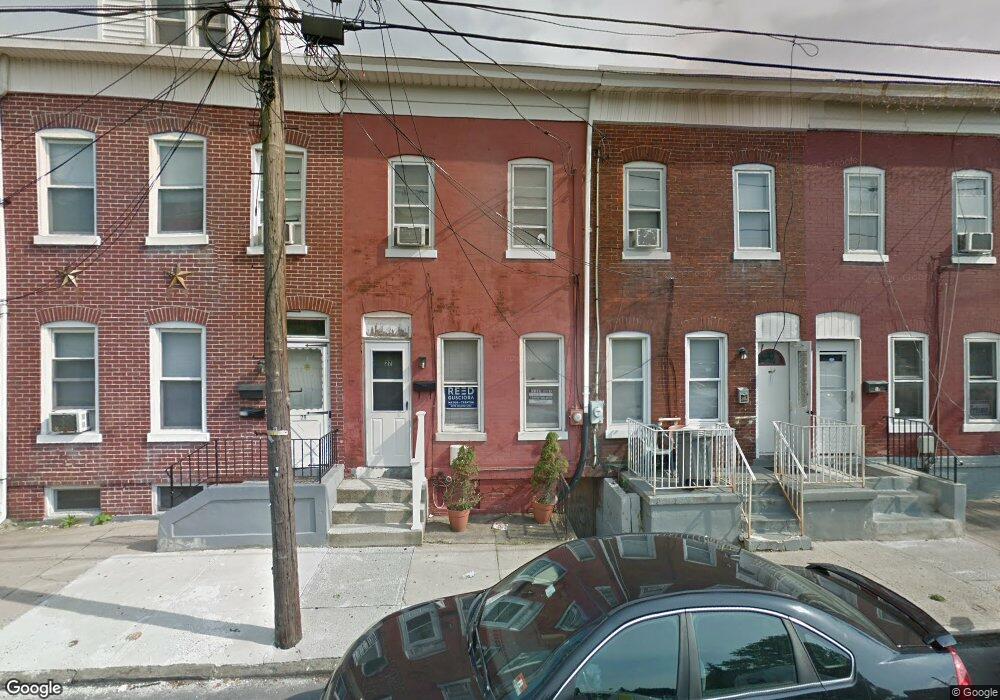
27 Swan St Trenton, NJ 08611
Chambersburg NeighborhoodEstimated Value: $160,231 - $232,000
--
Bed
--
Bath
1,180
Sq Ft
$164/Sq Ft
Est. Value
About This Home
This home is located at 27 Swan St, Trenton, NJ 08611 and is currently estimated at $193,308, approximately $163 per square foot. 27 Swan St is a home located in Mercer County with nearby schools including Robbins Elementary School, Monument Elementary School, and Grace A Dunn Middle School.
Ownership History
Date
Name
Owned For
Owner Type
Purchase Details
Closed on
Apr 30, 2008
Sold by
Maistro Lester J
Bought by
Hamilton Keith
Current Estimated Value
Home Financials for this Owner
Home Financials are based on the most recent Mortgage that was taken out on this home.
Original Mortgage
$91,858
Outstanding Balance
$58,507
Interest Rate
5.99%
Mortgage Type
New Conventional
Estimated Equity
$134,801
Purchase Details
Closed on
Apr 3, 2002
Sold by
Chiatti Carl
Bought by
Maisto Lester
Home Financials for this Owner
Home Financials are based on the most recent Mortgage that was taken out on this home.
Original Mortgage
$35,000
Interest Rate
6.85%
Create a Home Valuation Report for This Property
The Home Valuation Report is an in-depth analysis detailing your home's value as well as a comparison with similar homes in the area
Home Values in the Area
Average Home Value in this Area
Purchase History
| Date | Buyer | Sale Price | Title Company |
|---|---|---|---|
| Hamilton Keith | $93,300 | -- | |
| Maisto Lester | $39,000 | -- |
Source: Public Records
Mortgage History
| Date | Status | Borrower | Loan Amount |
|---|---|---|---|
| Open | Hamilton Keith | $91,858 | |
| Previous Owner | Maisto Lester | $35,000 |
Source: Public Records
Tax History Compared to Growth
Tax History
| Year | Tax Paid | Tax Assessment Tax Assessment Total Assessment is a certain percentage of the fair market value that is determined by local assessors to be the total taxable value of land and additions on the property. | Land | Improvement |
|---|---|---|---|---|
| 2025 | $2,599 | $44,800 | $8,100 | $36,700 |
| 2024 | $2,494 | $44,800 | $8,100 | $36,700 |
| 2023 | $2,494 | $44,800 | $8,100 | $36,700 |
| 2022 | $2,445 | $44,800 | $8,100 | $36,700 |
| 2021 | $2,488 | $44,800 | $8,100 | $36,700 |
| 2020 | $2,480 | $44,800 | $8,100 | $36,700 |
| 2019 | $2,440 | $44,800 | $8,100 | $36,700 |
| 2018 | $2,335 | $44,800 | $8,100 | $36,700 |
| 2017 | $2,220 | $44,800 | $8,100 | $36,700 |
| 2016 | $3,216 | $55,900 | $17,500 | $38,400 |
| 2015 | $3,205 | $55,900 | $17,500 | $38,400 |
| 2014 | $3,190 | $55,900 | $17,500 | $38,400 |
Source: Public Records
Map
Nearby Homes