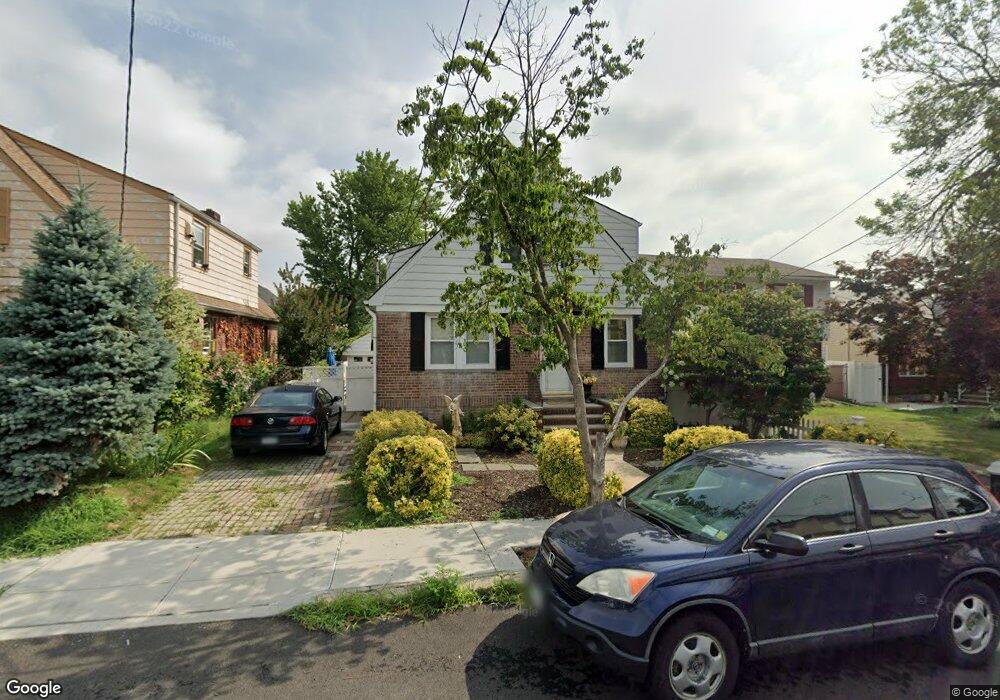
27 Tabb Place Staten Island, NY 10302
Port Richmond NeighborhoodEstimated Value: $632,000 - $825,000
--
Bed
--
Bath
1,356
Sq Ft
$517/Sq Ft
Est. Value
About This Home
This home is located at 27 Tabb Place, Staten Island, NY 10302 and is currently estimated at $701,445, approximately $517 per square foot. 27 Tabb Place is a home located in Richmond County with nearby schools including P.S. 22 Graniteville, I.S. 51 Edwin Markham, and Port Richmond High School.
Ownership History
Date
Name
Owned For
Owner Type
Purchase Details
Closed on
Oct 1, 2024
Sold by
Cammarata Laura L
Bought by
Paolillo Patricia
Current Estimated Value
Purchase Details
Closed on
Aug 16, 2024
Sold by
Paolillo Family Trust and Paolillo Patricia
Bought by
Cammarata Laura L
Purchase Details
Closed on
Mar 13, 2017
Sold by
Paolillo Patricia
Bought by
Paolillo Patricia
Purchase Details
Closed on
Feb 6, 2002
Sold by
Ruperto Patricia and Paolillo Patricia
Bought by
Paolillo Steven and Paolillo Patricia
Purchase Details
Closed on
Apr 19, 2001
Sold by
Ruperto Patricia
Bought by
Paolillo Steven and Paolillo Patricia
Home Financials for this Owner
Home Financials are based on the most recent Mortgage that was taken out on this home.
Original Mortgage
$6,138
Interest Rate
7.18%
Create a Home Valuation Report for This Property
The Home Valuation Report is an in-depth analysis detailing your home's value as well as a comparison with similar homes in the area
Home Values in the Area
Average Home Value in this Area
Purchase History
| Date | Buyer | Sale Price | Title Company |
|---|---|---|---|
| Paolillo Patricia | -- | Big Apple Title | |
| Cammarata Laura L | -- | Big Apple Title | |
| Cammarata Laura L | -- | Big Apple Title | |
| Paolillo Patricia | -- | None Available | |
| Paolillo Steven | -- | Commonwealth Land Title Ins | |
| Paolillo Steven | -- | -- |
Source: Public Records
Mortgage History
| Date | Status | Borrower | Loan Amount |
|---|---|---|---|
| Previous Owner | Paolillo Steven | $6,138 |
Source: Public Records
Tax History Compared to Growth
Tax History
| Year | Tax Paid | Tax Assessment Tax Assessment Total Assessment is a certain percentage of the fair market value that is determined by local assessors to be the total taxable value of land and additions on the property. | Land | Improvement |
|---|---|---|---|---|
| 2025 | $3,968 | $42,000 | $6,083 | $35,917 |
| 2024 | $2,653 | $34,320 | $7,118 | $27,202 |
| 2023 | $2,451 | $26,438 | $7,785 | $18,653 |
| 2022 | $2,650 | $27,420 | $9,240 | $18,180 |
| 2021 | $2,579 | $28,920 | $9,240 | $19,680 |
| 2020 | $2,463 | $28,560 | $9,240 | $19,320 |
| 2019 | $3,200 | $25,080 | $9,240 | $15,840 |
| 2018 | $3,158 | $22,032 | $7,624 | $14,408 |
| 2017 | $3,752 | $21,573 | $7,873 | $13,700 |
| 2016 | $3,759 | $20,352 | $7,255 | $13,097 |
| 2015 | $3,218 | $19,200 | $7,680 | $11,520 |
| 2014 | $3,218 | $18,360 | $7,680 | $10,680 |
Source: Public Records
Map
Nearby Homes
- 263 Decker Ave
- 47 Montell St
- 46 Catherine St
- 469 Port Richmond Ave
- 338 Decker Ave
- 616 Port Richmond Ave
- 28 Hooker Place
- 125 Decker Ave
- 646 Port Richmond Ave
- 11 Laforge Ave
- 646-662 Port Richmond Ave
- 348 Decker Ave
- 152 Cortlandt St
- 155 Cortlandt St
- 14 van Riper St
- 39 van Riper St
- 67 Lexington Ave
- 1328 Forest Ave
- 22 Marianne St
- 21 Dryden Ct