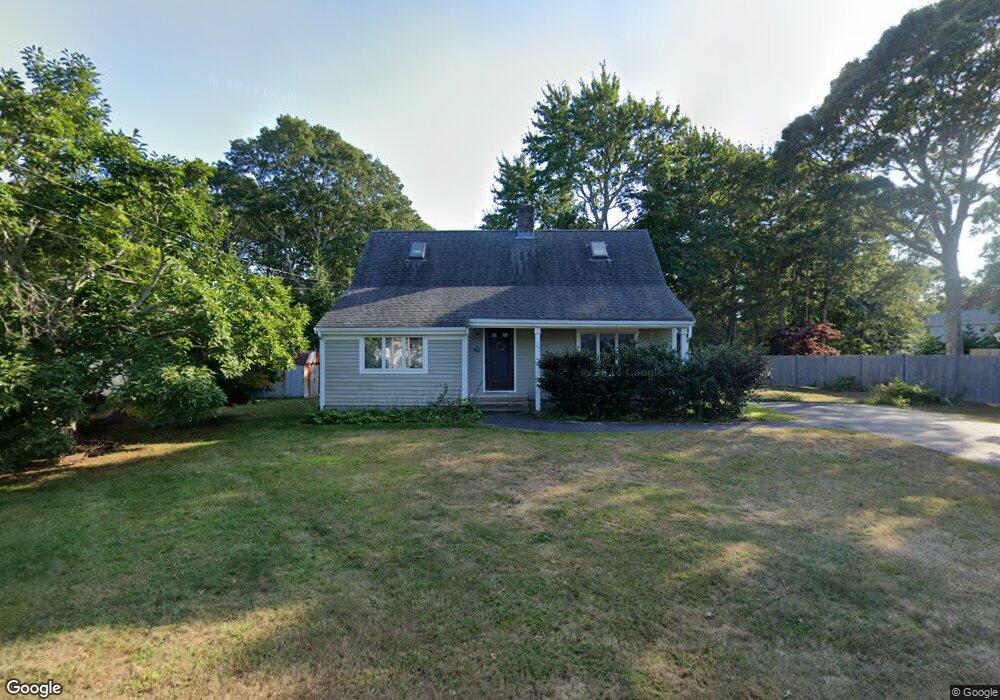
27 Tanager Rd Hyannis, MA 02601
Estimated Value: $622,864 - $654,000
3
Beds
2
Baths
1,380
Sq Ft
$461/Sq Ft
Est. Value
About This Home
This home is located at 27 Tanager Rd, Hyannis, MA 02601 and is currently estimated at $636,716, approximately $461 per square foot. 27 Tanager Rd is a home located in Barnstable County with nearby schools including Hyannis West Elementary School, Barnstable United Elementary School, and Barnstable Intermediate School.
Ownership History
Date
Name
Owned For
Owner Type
Purchase Details
Closed on
Oct 22, 2024
Sold by
Wang Jian
Bought by
Wang Jian and Situ Danqin
Current Estimated Value
Purchase Details
Closed on
Oct 31, 2012
Sold by
Situ Danqin and Wang Jian
Bought by
Wang Jian
Purchase Details
Closed on
Jan 11, 2012
Sold by
Greenberg Polina and Greenberg Boris
Bought by
Situ Danquin
Purchase Details
Closed on
Feb 5, 1993
Sold by
Yamasaki Toshimishi and Yamasaki Atsumi
Bought by
Greenberg Haskel
Create a Home Valuation Report for This Property
The Home Valuation Report is an in-depth analysis detailing your home's value as well as a comparison with similar homes in the area
Home Values in the Area
Average Home Value in this Area
Purchase History
| Date | Buyer | Sale Price | Title Company |
|---|---|---|---|
| Wang Jian | -- | None Available | |
| Wang Jian | -- | None Available | |
| Wang Jian | -- | -- | |
| Situ Danquin | $249,000 | -- | |
| Greenberg Haskel | $91,000 | -- | |
| Wang Jian | -- | -- | |
| Greenberg Haskel | $91,000 | -- |
Source: Public Records
Tax History Compared to Growth
Tax History
| Year | Tax Paid | Tax Assessment Tax Assessment Total Assessment is a certain percentage of the fair market value that is determined by local assessors to be the total taxable value of land and additions on the property. | Land | Improvement |
|---|---|---|---|---|
| 2025 | $4,792 | $516,900 | $146,700 | $370,200 |
| 2024 | $4,494 | $496,600 | $146,700 | $349,900 |
| 2023 | $4,239 | $442,900 | $133,300 | $309,600 |
| 2022 | $4,140 | $357,800 | $98,800 | $259,000 |
| 2021 | $2,240 | $321,400 | $98,800 | $222,600 |
| 2020 | $3,900 | $316,300 | $98,800 | $217,500 |
| 2019 | $1,747 | $293,900 | $98,800 | $195,100 |
| 2018 | $1,854 | $271,600 | $104,000 | $167,600 |
| 2017 | $1,661 | $263,400 | $104,000 | $159,400 |
| 2016 | $3,111 | $265,200 | $105,800 | $159,400 |
| 2015 | $2,962 | $256,000 | $100,900 | $155,100 |
Source: Public Records
Map
Nearby Homes