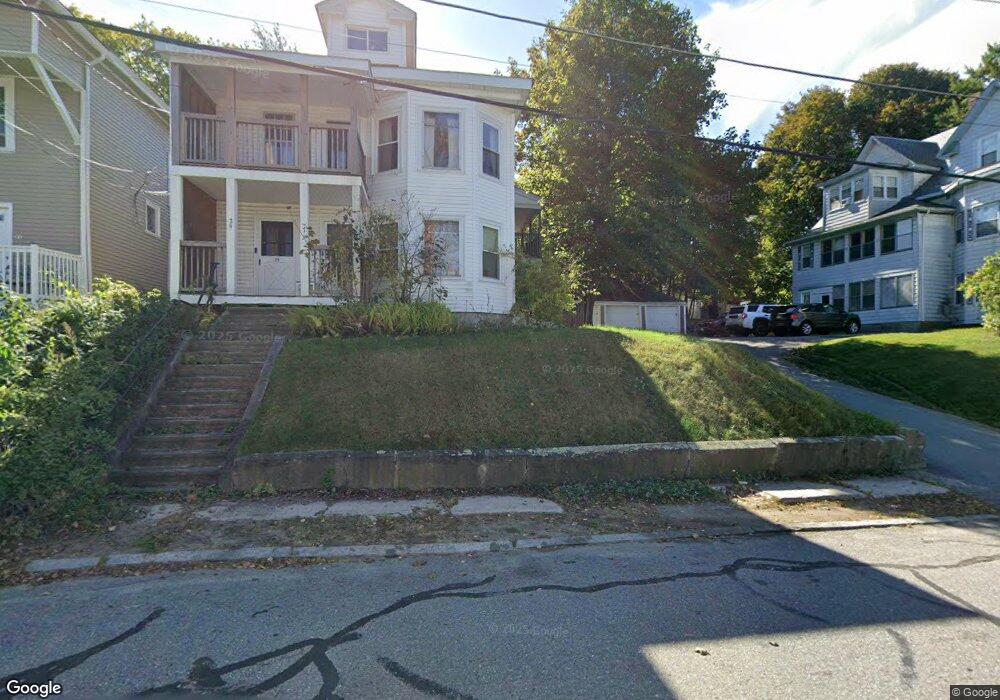
27 Thomas St Unit 29 Fitchburg, MA 01420
Southside NeighborhoodEstimated Value: $345,000 - $357,641
4
Beds
2
Baths
2,392
Sq Ft
$146/Sq Ft
Est. Value
About This Home
This home is located at 27 Thomas St Unit 29, Fitchburg, MA 01420 and is currently estimated at $350,410, approximately $146 per square foot. 27 Thomas St Unit 29 is a home located in Worcester County with nearby schools including South Street Elementary School, Reingold Elementary School, and Crocker Elementary School.
Ownership History
Date
Name
Owned For
Owner Type
Purchase Details
Closed on
Mar 15, 2023
Sold by
Bourque William R and Bourque Linda D
Bought by
May Jarad and Cluett Jillian
Current Estimated Value
Home Financials for this Owner
Home Financials are based on the most recent Mortgage that was taken out on this home.
Original Mortgage
$210,000
Outstanding Balance
$203,360
Interest Rate
6.09%
Mortgage Type
Purchase Money Mortgage
Estimated Equity
$147,050
Purchase Details
Closed on
Dec 18, 1973
Bought by
Bourque William R and Bourque Linda A
Create a Home Valuation Report for This Property
The Home Valuation Report is an in-depth analysis detailing your home's value as well as a comparison with similar homes in the area
Home Values in the Area
Average Home Value in this Area
Purchase History
| Date | Buyer | Sale Price | Title Company |
|---|---|---|---|
| May Jarad | $280,000 | None Available | |
| Bourque William R | $24,000 | -- |
Source: Public Records
Mortgage History
| Date | Status | Borrower | Loan Amount |
|---|---|---|---|
| Open | May Jarad | $210,000 |
Source: Public Records
Tax History Compared to Growth
Tax History
| Year | Tax Paid | Tax Assessment Tax Assessment Total Assessment is a certain percentage of the fair market value that is determined by local assessors to be the total taxable value of land and additions on the property. | Land | Improvement |
|---|---|---|---|---|
| 2025 | $36 | $268,900 | $97,100 | $171,800 |
| 2024 | $5,123 | $345,900 | $59,400 | $286,500 |
| 2023 | $4,703 | $293,600 | $51,100 | $242,500 |
| 2022 | $4,270 | $242,500 | $42,800 | $199,700 |
| 2021 | $3,977 | $209,000 | $30,900 | $178,100 |
| 2020 | $3,400 | $172,500 | $28,500 | $144,000 |
| 2019 | $3,211 | $156,700 | $40,400 | $116,300 |
| 2018 | $3,025 | $144,000 | $38,000 | $106,000 |
| 2017 | $2,796 | $130,100 | $38,000 | $92,100 |
| 2016 | $2,654 | $125,000 | $34,400 | $90,600 |
| 2015 | $2,490 | $120,400 | $33,300 | $87,100 |
| 2014 | $2,388 | $120,400 | $33,300 | $87,100 |
Source: Public Records
Map
Nearby Homes
- 27-29 Thomas St
- 31-33 Thomas St Unit 3
- 31-33 Thomas St Unit 1
- 31-33 Thomas St Unit 2
- 31-33 Thomas St
- 31 Thomas St Unit 33
- 17 Thomas St Unit 4
- 17 Thomas St
- 27 Elizabeth St Unit 29
- 27 Elizabeth St Unit 2
- 27-29 Elizabeth St
- 33 Elizabeth St
- 41 Thomas St
- 21 Elizabeth St
- 18 Thomas St Unit 20
- 16 Thomas St Unit 1
- 20 Thomas St Unit 20
- 37 Elizabeth St Unit 39
- 7 Thomas St
- 21 Francis St