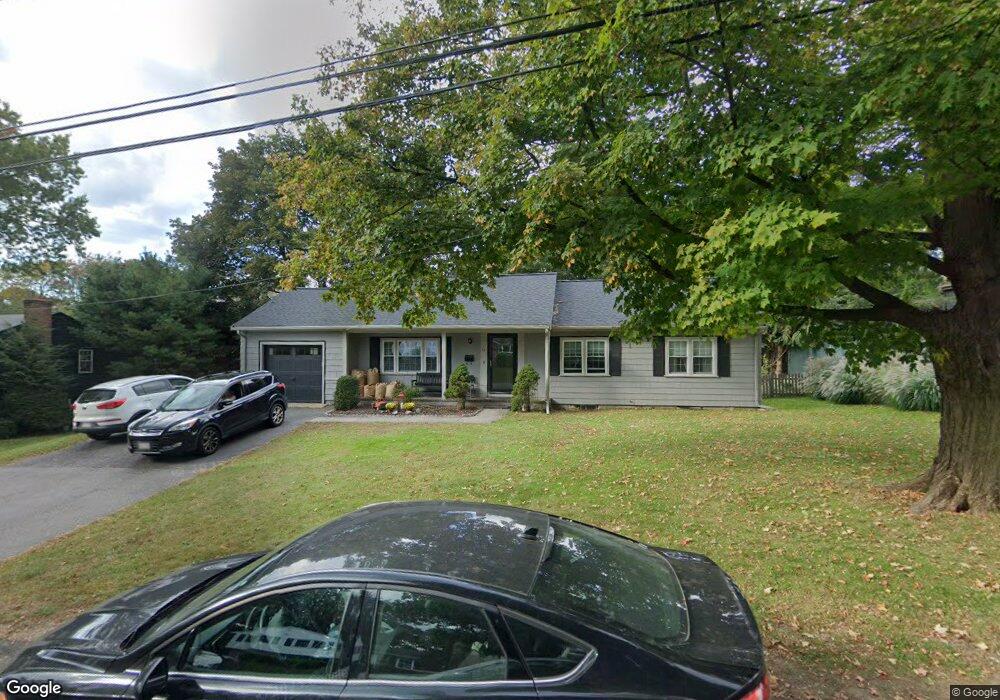
27 Thompson St Dedham, MA 02026
Oakdale NeighborhoodEstimated Value: $729,000 - $785,000
3
Beds
2
Baths
1,222
Sq Ft
$613/Sq Ft
Est. Value
About This Home
This home is located at 27 Thompson St, Dedham, MA 02026 and is currently estimated at $749,353, approximately $613 per square foot. 27 Thompson St is a home located in Norfolk County with nearby schools including Oakdale Elementary School, Dedham Middle School, and Dedham High School.
Ownership History
Date
Name
Owned For
Owner Type
Purchase Details
Closed on
Jun 19, 2000
Sold by
Odonovan Thomas
Bought by
Glennon Cynthia and Glennon Thomas P
Current Estimated Value
Create a Home Valuation Report for This Property
The Home Valuation Report is an in-depth analysis detailing your home's value as well as a comparison with similar homes in the area
Home Values in the Area
Average Home Value in this Area
Purchase History
We collect this data history from publicly available records. To have your information removed, we recommend requesting removal directly through your county’s website.
| Date | Buyer | Sale Price | Title Company |
|---|---|---|---|
| Glennon Cynthia | $250,000 | -- |
Source: Public Records
Mortgage History
We collect this data history from publicly available records. To have your information removed, we recommend requesting removal directly through your county’s website.
| Date | Status | Borrower | Loan Amount |
|---|---|---|---|
| Open | Glennon Cynthia | $333,000 | |
| Closed | Glennon Cynthia | $14,000 | |
| Closed | Glennon Cynthia | $173,000 |
Source: Public Records
Tax History
| Year | Tax Paid | Tax Assessment Tax Assessment Total Assessment is a certain percentage of the fair market value that is determined by local assessors to be the total taxable value of land and additions on the property. | Land | Improvement |
|---|---|---|---|---|
| 2025 | $8,288 | $656,700 | $386,200 | $270,500 |
| 2024 | $7,925 | $634,000 | $355,700 | $278,300 |
| 2023 | $7,561 | $588,900 | $330,100 | $258,800 |
| 2022 | $7,043 | $527,600 | $301,800 | $225,800 |
| 2021 | $6,988 | $511,200 | $301,800 | $209,400 |
| 2020 | $6,738 | $491,100 | $289,200 | $201,900 |
| 2019 | $6,564 | $463,900 | $262,500 | $201,400 |
| 2018 | $6,182 | $424,900 | $238,300 | $186,600 |
| 2017 | $6,139 | $415,900 | $229,300 | $186,600 |
| 2016 | $6,092 | $393,300 | $203,900 | $189,400 |
| 2015 | $5,662 | $356,800 | $198,400 | $158,400 |
| 2014 | $5,477 | $340,600 | $198,400 | $142,200 |
Source: Public Records
Map
Nearby Homes
- 173 Jefferson St
- 315 Central Ave
- 989 East St Unit 310
- 180 Walnut St
- 25 Cynthia Rd
- 18 Fales Rd
- 105 Oakdale Ave
- 113 Oakdale Ave
- 1044 East St
- 152 Sprague St
- 93 Alden St
- 42 Stoughton Rd
- 352 Whiting Ave
- 73 Walnut St
- 150 River St
- 214 Sprague St
- 22 Azalea Cir
- 1139 East St
- 113 Ledgewood Rd
- 90 High St Unit 309
Your Personal Tour Guide
Ask me questions while you tour the home.